MATLAB: An Introduction with Applications
6th Edition
ISBN: 9781119256830
Author: Amos Gilat
Publisher: John Wiley & Sons Inc
expand_more
expand_more
format_list_bulleted
Question
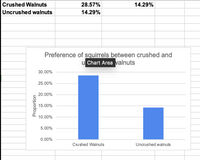
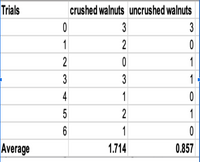
Do the paired t-test for the following crushed and uncrushed nuts data and then interpret it.

Transcribed Image Text:Crushed Walnuts
28.57%
14.29%
Uncrushed walnuts
14.29%
Preference of squirrels between crushed and
u Chart Area valnuts
30.00%
25.00%
20.00%
15.00%
10.00%
5.00%
0.00%
Crushed Walnuts
Uncrushed walnuts
Proportion

Transcribed Image Text:Trials
crushed walnuts uncrushed walnuts
3
3
1
2
ㅇ
2
1
3
3
1
4
1
ㅇ
5
2
1
1
Average
1.714
0.857
Expert Solution
This question has been solved!
Explore an expertly crafted, step-by-step solution for a thorough understanding of key concepts.
Step by stepSolved in 4 steps with 3 images

Knowledge Booster
Similar questions
- ent.htm Tube Bdass roooom get more math! North America Holt McDougal Onli.. Mechanical Keyboa... 500 Imported #1 Hand in Exam A boss measures the time it takes each employee to complete a task. The first quartile value of the boss's data is 6 minutes. The median is 18 minutes. Which statements must be true? ORDER OF OPERATIONS L 000 Select two correct answers. About 50% of the employees completed the task in 6 minutes or less. About 50% of the employees completed the task in 18 minutes or less. Exactly 25% of the employees completed the task in exactly 6 minutes. About 25% of the employees completed the task in 6 minutes or less. About 25% of the employees completed the task in 18 minutes or less. hp S. Melendez <arrow_forwardUse the same scales to construct boxplots for the pulse rates of males and females from the accompanying data sets. Use the boxplots to compare the two data sets. Click the icon to view the data sets. 40 50 60 70 80 90 100110 40 50 60 70 80 90 100110 OC. D. 40 50 60 70 80 90 100110 40 50 60 70 80 90 100110 Determine the boxplot for the women's boxplot data. A. В. 40 50 60 70 80 90 100110 40 50 60 70 80 90 100110 OC. OD. 40 50 60 70 80 90 100110 40 50 60 70 80 90 100110arrow_forwardFind the five-number summary for the following set of data. Data 2 7 9 10 12 12 16 17 21 21 25 Min=Q1= Q2= Q3= Max=arrow_forward
- Determine the interquartile range of the following data: 155, 134, 153, 119, 89.arrow_forwardName 3) The Tire Rack, an online distributor of tires and wheels, conducts extensive testing to provide customers with products that are right for their vehicle, driving style, and driving conditions. In addition, the Tire Rack maintains an independent customer survey to help drivers help each other by sharing their long-term tire experiences (The Tire Rack website, August 1, 2016). The following data shows survey results (one to 10 scale with 10 being the highest rating) for 18 high performance all season tires. The variable tread wear rates quickness of wear based on drivers expectations, the variability dry traction rates the grip of a tire on a dry road, the variable steering rates the tires steering responsiveness, and the variable buy again rates the driver's desire to purchase the same tire again. Tire Sumitomo HTR A/S PO2 Goodyear Eagle Sport All-Season Michelin Pilot Sport A/S 3 Kumho Ecsta PA 31 Firestone Firehawk Wide Oval AS BFGoodrich g-Force Super Sport A/S Yokohama AVID…arrow_forwardThe following set of data represents the number of orders filled by a national-chain restaurant during a two week period. Construct a five number summary for the the data. 66, 75, 68, 89, 86, 73, 67, 75, 75, 82, 85, 74, 67, 61 (Round to the nearest hundredth, if needed). Min _________________ Lower Quartile _________________ Median __________________ Upper Quartile _________________ Maximum __________________ What is the range and the interquartile range (IQR)? Range __________________ Interquartile Range (IQR) ___________________arrow_forward
- A. Refer to the data and solve for the required measures of position. The following are the grades of 25 students in the first marking period of their Calculus I class. 65, 68, 70, 71, 73, 75, 75, 76, 78, 78, 79, 80, 83, 85, 87, 88, 89, 90, 90, 91, 93, 94, 95, 95, 97arrow_forwardI need help on # 3, and 4 pleasearrow_forwardFrank’s Furniture employees earned the following amounts last week: $351.96 $195.35 $219.93 $492.35 $544.40 $250.90 $363.64 $455.08 $286.12 What is the IQR for this data set?arrow_forward
arrow_back_ios
SEE MORE QUESTIONS
arrow_forward_ios
Recommended textbooks for you
 MATLAB: An Introduction with ApplicationsStatisticsISBN:9781119256830Author:Amos GilatPublisher:John Wiley & Sons Inc
 Probability and Statistics for Engineering and th...StatisticsISBN:9781305251809Author:Jay L. DevorePublisher:Cengage Learning
 Statistics for The Behavioral Sciences (MindTap C...StatisticsISBN:9781305504912Author:Frederick J Gravetter, Larry B. WallnauPublisher:Cengage Learning
 Elementary Statistics: Picturing the World (7th E...StatisticsISBN:9780134683416Author:Ron Larson, Betsy FarberPublisher:PEARSON
 The Basic Practice of StatisticsStatisticsISBN:9781319042578Author:David S. Moore, William I. Notz, Michael A. FlignerPublisher:W. H. Freeman
 Introduction to the Practice of StatisticsStatisticsISBN:9781319013387Author:David S. Moore, George P. McCabe, Bruce A. CraigPublisher:W. H. Freeman

MATLAB: An Introduction with Applications
Statistics
ISBN:9781119256830
Author:Amos Gilat
Publisher:John Wiley & Sons Inc

Probability and Statistics for Engineering and th...
Statistics
ISBN:9781305251809
Author:Jay L. Devore
Publisher:Cengage Learning

Statistics for The Behavioral Sciences (MindTap C...
Statistics
ISBN:9781305504912
Author:Frederick J Gravetter, Larry B. Wallnau
Publisher:Cengage Learning

Elementary Statistics: Picturing the World (7th E...
Statistics
ISBN:9780134683416
Author:Ron Larson, Betsy Farber
Publisher:PEARSON

The Basic Practice of Statistics
Statistics
ISBN:9781319042578
Author:David S. Moore, William I. Notz, Michael A. Fligner
Publisher:W. H. Freeman

Introduction to the Practice of Statistics
Statistics
ISBN:9781319013387
Author:David S. Moore, George P. McCabe, Bruce A. Craig
Publisher:W. H. Freeman