0 25 50 20 Depth 20 19 19 18 16 14 12 75 100 125 10 Depth| 17 15 14 2- 50 175 200 150 50 100 150 200 Distance from center Depth 10 (in feet) Depth (in feet)


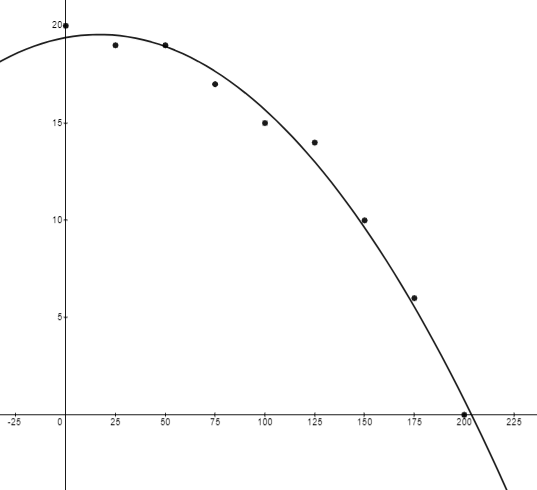
A pond is approximately circular, with a diameter of 400 feet. Starting at the center, the depth of the water is measured every 25 feet and recorded in the table (a) Use the regression capabilities of a graphing utility to find a quadratic model for the depths recorded in the table. Use the graphing utility to plot the depths and graph the model. (b) Use the

The given data,
| x | 0 | 25 | 50 | 75 | 100 | 125 | 150 | 175 | 200 |
| Depth | 20 | 19 | 19 | 17 | 15 | 14 | 10 | 6 | 0 |
We have to find,
(a) The regression equation for a quadratic model for the depths recorded in the table.
(b) Using the integration capabilities of a graphing utility and the model in part (a) we have to approximate the volume of water in the pond.
(c) Use the result of part (b) to approximate the number of gallons of water in the pond.
a)
The given data,
| x | 0 | 25 | 50 | 75 | 100 | 125 | 150 | 175 | 200 |
| Depth | 20 | 19 | 19 | 17 | 15 | 14 | 10 | 6 | 0 |
Using the regression calculator,
The quadratic model for the depths is recorded in the table is .
Graph of the depths and the quadratic model.
b)
The formula for the volume of water in the pond is,
.
Here and .
Now,
Solve this integral we get
The volume of water in the pond is .

Step by step
Solved in 5 steps with 1 images


