
MATLAB: An Introduction with Applications
6th Edition
ISBN: 9781119256830
Author: Amos Gilat
Publisher: John Wiley & Sons Inc
expand_more
expand_more
format_list_bulleted
Related questions
Question
#20 part b only- show full work for psych stats

Transcribed Image Text:### Exercise and Psychological Well-being
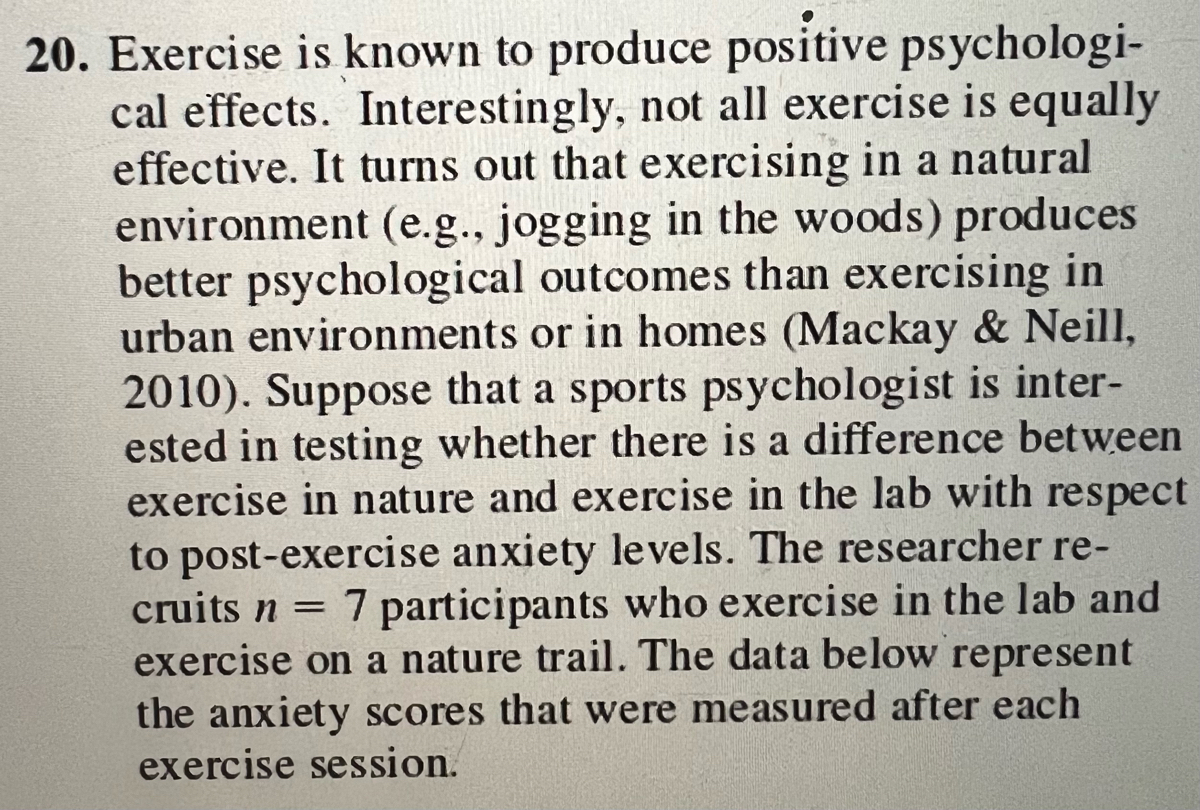
Exercise is known to produce positive psychological effects. Interestingly, not all exercise is equally effective. Research indicates that exercising in a natural environment (e.g., jogging in the woods) produces better psychological outcomes than exercising in urban environments or in homes (Mackay & Neill, 2010).
A sports psychologist is interested in testing whether there is a difference between exercise in nature and exercise in the lab concerning post-exercise anxiety levels. The researcher recruits \( n = 7 \) participants who exercise in the lab and on a nature trail. The following data represent the anxiety scores measured after each exercise session.

Transcribed Image Text:### Table of Anxiety Scores for Participants
| Participant | Anxiety after Exercising in Lab | Anxiety after Exercising in Nature |
|-------------|---------------------------------|----------------------------------|
| A | 32 | 8 |
| B | 66 | 68 |
| C | 52 | 48 |
| D | 48 | 37 |
| E | 52 | 44 |
| F | 48 | 38 |
| G | 52 | 44 |
### Statistical Questions
a. **Independent-Measures Study Analysis**
Treat the data as if the scores are from an independent-measures study using two separate samples, each with \( n = 7 \) participants. Compute the pooled variance, the estimated standard error for the mean difference, and the independent-measures t statistic. Using \( \alpha = .05 \), is there a significant difference between the two sets of scores?
b. **Repeated-Measures Study Analysis**
Assume the data are from a repeated-measures study using the same sample of \( n = 7 \) participants in both treatment conditions. Compute the variance for the sample of difference scores, the estimated standard error for the mean difference, and the repeated-measures t statistic. Using \( \alpha = .05 \), is there a significant difference between the two sets of scores?
Expert Solution
This question has been solved!
Explore an expertly crafted, step-by-step solution for a thorough understanding of key concepts.

This is a popular solution

Trending nowThis is a popular solution!

Step by stepSolved in 3 steps

Knowledge Booster

Similar questions
- Background information: Allison collected additional days of data to monitor the process. Steps to monitor using the control charts: Now monitor the process. An additional ten days of data have been collected, see table labeled “1st 10 Days of Monitoring Reservation Processing Time” in the Data File. Develop Xbar and R charts for the 1st 10 days of monitoring. Plot the data for the 1st 10 days on the Xbar and R charts. Is the process in control? If the control chart indicates an out-of-control process, note which days, the pattern, and whether it is the Xbar or R chart. Now that we have set up the control charts using enough data from a stable process, the 30 days of data, we will monitor the process. While monitoring the process, what will we use as the upper control limit for the R (range) Chart to compare against our new range values? Enter your response to three decimal places. You do not need to include the units (minutes), ONLY the numeric value. USE EXCELL DATA TO GET…arrow_forwardCalculate the GPA of a student with the following grades: C (17 hours), A (21 hours), D (13 hours). Note that an A is equivalent to 4.0, a B is equivalent to a 3.0, a C is equivalent to a 2.0, a D is equivalent to a 1.0, and an F is equivalent to a 0. Round your answer to two decimal places.arrow_forwardHow high must a vehicle's gas mileage be in order to fall in the top 15% of all vehicles?arrow_forward
- please help!! Weather: Weather data for Hamilton January 2020 Research question: The average temperature of Hamilton in January 2020 was less than 32°F (0°C). The data is available at Weather in Hamilton in January 2020 (Ontario) - Detailed Weather Forecast for a Month (world-weather. info) A) Please, with these statistical data up there, help me apply as many calculations and rates as necessary to collect as much information as possible on this subject. Find some information that I could apply and explain on this subject. With calculations too. you will be helping me alot filling the infos that I need.arrow_forwardYou've been on a diet and been using a scale to keep track of the weight of how much food you are eating. Is that a discrete or a continuous measure? Explain your answer.arrow_forwardThe number of measles cases decreased by 6% to 586 cases this year. What was the number of cases prior to the decrease? Express your answer rounded correctly to the nearest whole number.arrow_forward
arrow_back_ios
arrow_forward_ios
Recommended textbooks for you
- MATLAB: An Introduction with ApplicationsStatisticsISBN:9781119256830Author:Amos GilatPublisher:John Wiley & Sons Inc
 Probability and Statistics for Engineering and th...StatisticsISBN:9781305251809Author:Jay L. DevorePublisher:Cengage Learning
 Statistics for The Behavioral Sciences (MindTap C...StatisticsISBN:9781305504912Author:Frederick J Gravetter, Larry B. WallnauPublisher:Cengage Learning
  Elementary Statistics: Picturing the World (7th E...StatisticsISBN:9780134683416Author:Ron Larson, Betsy FarberPublisher:PEARSON
 The Basic Practice of StatisticsStatisticsISBN:9781319042578Author:David S. Moore, William I. Notz, Michael A. FlignerPublisher:W. H. Freeman
 Introduction to the Practice of StatisticsStatisticsISBN:9781319013387Author:David S. Moore, George P. McCabe, Bruce A. CraigPublisher:W. H. Freeman
MATLAB: An Introduction with Applications
Statistics
ISBN:9781119256830
Author:Amos Gilat
Publisher:John Wiley & Sons Inc
Probability and Statistics for Engineering and th...
Statistics
ISBN:9781305251809
Author:Jay L. Devore
Publisher:Cengage Learning
Statistics for The Behavioral Sciences (MindTap C...
Statistics
ISBN:9781305504912
Author:Frederick J Gravetter, Larry B. Wallnau
Publisher:Cengage Learning
Elementary Statistics: Picturing the World (7th E...
Statistics
ISBN:9780134683416
Author:Ron Larson, Betsy Farber
Publisher:PEARSON
The Basic Practice of Statistics
Statistics
ISBN:9781319042578
Author:David S. Moore, William I. Notz, Michael A. Fligner
Publisher:W. H. Freeman
Introduction to the Practice of Statistics
Statistics
ISBN:9781319013387
Author:David S. Moore, George P. McCabe, Bruce A. Craig
Publisher:W. H. Freeman