
MATLAB: An Introduction with Applications
6th Edition
ISBN: 9781119256830
Author: Amos Gilat
Publisher: John Wiley & Sons Inc
expand_more
expand_more
format_list_bulleted
Related questions
Question
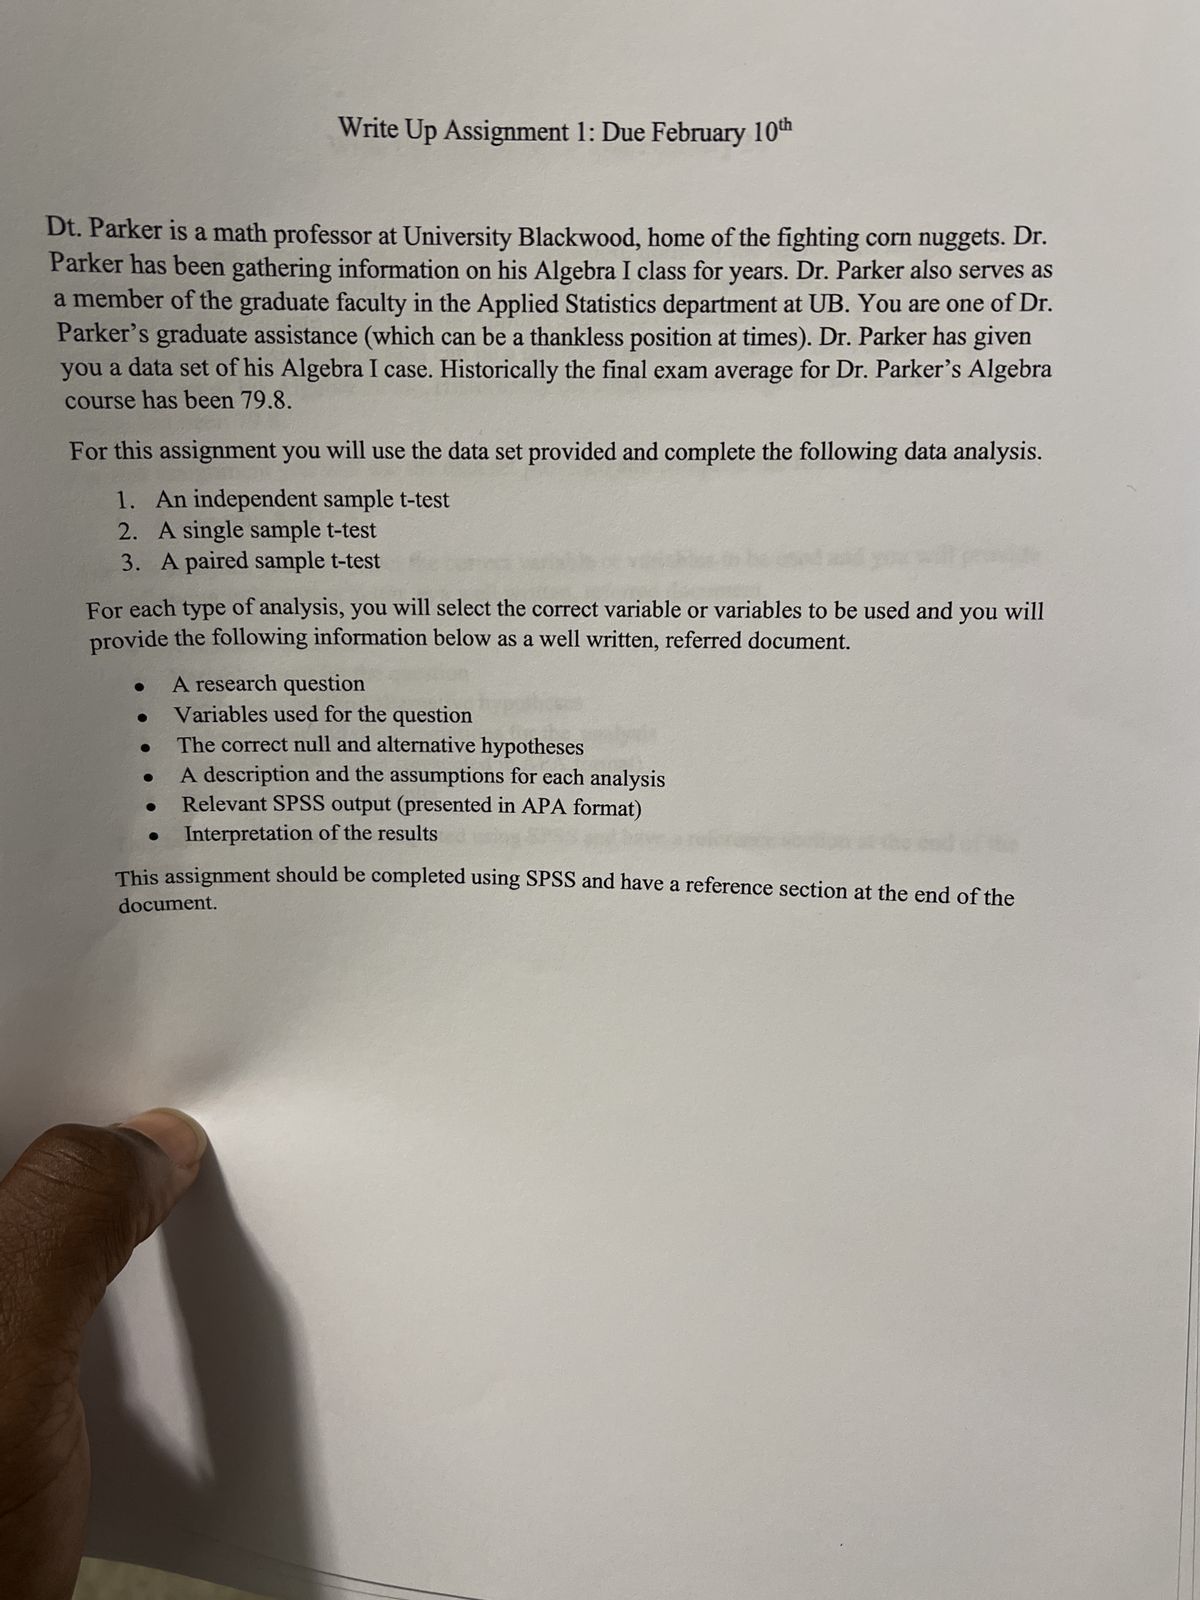

Transcribed Image Text:Write Up Assignment 1: Due February 10th
Dt. Parker is a math professor at University Blackwood, home of the fighting corn nuggets. Dr.
Parker has been gathering information on his Algebra I class for years. Dr. Parker also serves as
a member of the graduate faculty in the Applied Statistics department at UB. You are one of Dr.
Parker's graduate assistance (which can be a thankless position at times). Dr. Parker has given
you a data set of his Algebra I case. Historically the final exam average for Dr. Parker's Algebra
course has been 79.8.
For this assignment you will use the data set provided and complete the following data analysis.
1. An independent sample t-test
2. A single sample t-test
3. A paired sample t-test
For each type of analysis, you will select the correct variable or variables to be used and you will
provide the following information below as a well written, referred document.
A research question
Variables used for the question
The correct null and alternative hypotheses
A description and the assumptions for each analysis
Relevant SPSS output (presented in APA format)
Interpretation of the results
This assignment should be completed using SPSS and have a reference section at the end of the
document.
Expert Solution
This question has been solved!
Explore an expertly crafted, step-by-step solution for a thorough understanding of key concepts.

Step by stepSolved in 2 steps

Knowledge Booster

Similar questions
- Please complete the following question. Make sure you are responding to all parts of the question. The number of awards earned by students at one high school is recorded. Predictors of the number of awards earned include the type of program in which the student was enrolled (e.g., vocational, general or academic) and the score on their final exam in math. Variables Participant number (ID) Number of awards Program type (vocational - 1; general - 2; academic - 3 Math Score id num_awards prog math 45 1 3 41 108 1 1 41 15 1 3 44 67 1 3 42 153 1 3 40 51 1 1 42 164 1 3 46 133 1 3 40 2 1 3 33 53 1 3 46 1 1 3 40 128 0 2 38 16 1 3 44 106 1 3 37 89 1 3 40 134 1 1 39 19 1 1 43 145 0 3 38 11 1 2 45 117 0 3 39 109 1 1 42 12 1 3 45 37 1 3 40 69 0 3 40 43 1 2 43…arrow_forwardHi i’m in grade 12 Data Management and i need help with this practice questionarrow_forwardPlease please answer fast please answer as fast as possible please it's super important and super urgentarrow_forward
- The whole data set will be in the two picturesarrow_forwardThe Acme School of Locksmiths has been accredited for the past 15 years. Discuss how this information might be interpreted as a a. qualitative variable b. quantitative variablearrow_forwardWhat percentage of data would you predict would be between 25 and 50 and what percentage would you predict would be more than 50 miles? Use the Week 4 spreadsheet again to find the percentage of the data set we expect to have values between 25 and 50 as well as for more than 50. Now determine the percentage of data points in the dataset that fall within each of these ranges, using same strategy as above for counting data points in the data set. How do each of these compare with your prediction and why is there a difference? Predicted percentage between 25 and 50: ________________________ Actual percentage: Predicted percentage more than 50 miles: Actual percentage: ___________________________________________ Comparison ____________________________________________________ Why? __________________________________________________________ Drive: 44 20 88 6 71 42 76 63 61 63 84 28 55 33 88 80 86 83 5 85 25 25 54 54 81 73 29 76 78…arrow_forward
- Letter (d) Would i be wrong if i said yes the data set consisting of the annual salary for each employee at the MNM company is a population since no employee salary is excluded from the dataarrow_forwardAll Greens is a franchise store that sells house plants and lawn and garden supplies. Although All Greens is a franchise, each store is owned and managed by private individuals. Some friends have asked you to go into business with them to open a new All Greens store in the suburbs of San Diego. The national franchise headquarters sent you the following information at your request. These data are about 27 All Greens stores in California. Each of the 27 stores has been doing very well, and you would like to use the information to help set up your own new store. The variables for which we have data are detailed below. x1 = annual net sales, in thousands of dollarsx2 = number of square feet of floor display in store, in thousands of square feetx3 = value of store inventory, in thousands of dollarsx4 = amount spent on local advertising, in thousands of dollarsx5 = size of sales district, in thousands of familiesx6 = number of competing or similar stores in sales district A sales district…arrow_forwardYou are the Provost of a University and you want to see if students would like to participate in classroom-based physical activity. You implemented a quick pilot test and collected data after Spring quarter. Below is the first set of data. Based on the data, answer the question. Age (1-18-24 Participant Height (inches) Weight (pounds) Sex (1= male, 2 = female) Ever participated in classroom exercise (1= No, 2 = Yes) years, 2=25-34 years, 3 35-49 years, 4 50 years or older) 1 66 150 1 1 1 2 72 150 2 2 4 3 66 150 2 1 2 4 74 215 1 2 1 5 66 112 2 2 6 71 215 2 2 7 69 175 2 2 3 8 66 152 2 1 9 72 375 1 10 66 140 1 2 What type of variable is sex and age? dichotomous, ordinal dichotomous, nominal O nominal, discrete nominal, dichotomousarrow_forward
- You want to determine how many loaves of Bread are sold per day at Schat’s Bakery. You stand outside for ten different randomly selected days, count the number of loaves, and then average them. You come up with 421 loaves per day. In reality, Schat’s keeps records of how many loaves they sell per day, and in they averaged 395 loaves per day. Describe what the population is in the above example?arrow_forward#121 Unit 4 Assessment Question 11 and 12.arrow_forwardThe box plots below show how fast cars are travelling at a specific time of a day on highway I-5 and l-405 in King county. Fill in the blank. I-405 I-5 45 50 55 60 65 70 75 Speed (miles per hour) If Jay is driving at the median speed on l-5, he is driving faster than % of drivers on l-405.arrow_forward
arrow_back_ios
SEE MORE QUESTIONS
arrow_forward_ios
Recommended textbooks for you
- MATLAB: An Introduction with ApplicationsStatisticsISBN:9781119256830Author:Amos GilatPublisher:John Wiley & Sons Inc
 Probability and Statistics for Engineering and th...StatisticsISBN:9781305251809Author:Jay L. DevorePublisher:Cengage Learning
 Statistics for The Behavioral Sciences (MindTap C...StatisticsISBN:9781305504912Author:Frederick J Gravetter, Larry B. WallnauPublisher:Cengage Learning
  Elementary Statistics: Picturing the World (7th E...StatisticsISBN:9780134683416Author:Ron Larson, Betsy FarberPublisher:PEARSON
 The Basic Practice of StatisticsStatisticsISBN:9781319042578Author:David S. Moore, William I. Notz, Michael A. FlignerPublisher:W. H. Freeman
 Introduction to the Practice of StatisticsStatisticsISBN:9781319013387Author:David S. Moore, George P. McCabe, Bruce A. CraigPublisher:W. H. Freeman
MATLAB: An Introduction with Applications
Statistics
ISBN:9781119256830
Author:Amos Gilat
Publisher:John Wiley & Sons Inc
Probability and Statistics for Engineering and th...
Statistics
ISBN:9781305251809
Author:Jay L. Devore
Publisher:Cengage Learning
Statistics for The Behavioral Sciences (MindTap C...
Statistics
ISBN:9781305504912
Author:Frederick J Gravetter, Larry B. Wallnau
Publisher:Cengage Learning
Elementary Statistics: Picturing the World (7th E...
Statistics
ISBN:9780134683416
Author:Ron Larson, Betsy Farber
Publisher:PEARSON
The Basic Practice of Statistics
Statistics
ISBN:9781319042578
Author:David S. Moore, William I. Notz, Michael A. Fligner
Publisher:W. H. Freeman
Introduction to the Practice of Statistics
Statistics
ISBN:9781319013387
Author:David S. Moore, George P. McCabe, Bruce A. Craig
Publisher:W. H. Freeman