MATLAB: An Introduction with Applications
6th Edition
ISBN: 9781119256830
Author: Amos Gilat
Publisher: John Wiley & Sons Inc
expand_more
expand_more
format_list_bulleted
Topic Video
Question

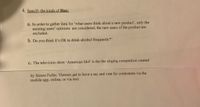
Transcribed Image Text:4. Specify the kinds of Bias:
a. In order to gather data for 'what users think about a new product', only the
existing users' opinions are considered, the new users of the product are
excluded.
b. Do you think it's OK to drink alcohol frequently?"
c. The television show 'American Idol' is the the singing competition created
by Simon Fuller. Viewers get to have a say and vote for contestants via the
mobile app, online, or via text.
Expert Solution
This question has been solved!
Explore an expertly crafted, step-by-step solution for a thorough understanding of key concepts.
This is a popular solution
Trending nowThis is a popular solution!
Step by stepSolved in 3 steps

Knowledge Booster
Learn more about
Need a deep-dive on the concept behind this application? Look no further. Learn more about this topic, statistics and related others by exploring similar questions and additional content below.Similar questions
- Help!!arrow_forwardALREADY HAVE FIRST THREE ANSWERS NEED THE REST. ANOVA. Dr. Milgram is conducting a patient satisfaction survey, rating how well her patients like her on a scale of 1-10. Her patients tend to fall into three categories: “Like a lot”, “like somewhat”, and “dislike a lot”. She believes that she might get different satisfaction scores from people in each group, but (because she's not great at numbers) she wants you to do an ANOVA to be sure. She has collected data from 12 patients (three equal groups) with the following results. Group 1) “Like a lot” Mean: 8 SS: 2 N: df: Group 2) “Like somewhat” Mean: 5 SS: 6 N: df: Group 3) “Dislike a lot” Mean: 2 SS: 4 N: df: Grand Mean: 4 df Within-Group: 9 df Between-Groups: 2 Estimated Variance (S21) for Group 1: _______ Estimated Variance (S22)…arrow_forwardThe process of moving from theory to data, where the data would test the theory, is known as.......?arrow_forward
- Please help asaparrow_forwardWe discuss how to test for an association between two categorical variables in Section 6.8. A marine research team records the number of fish from 3 species that they find at different depth categories in the ocean. They are interested in assessing whether or not there is a relationship between the depth category (close to surface, mid-level, ocean floor) and the fish species found (species A, species B, species C). A two-way table showing the classification of a sample of 150 observations is given below. If the variables for the ocean depth category and the species are independent, how would you calculate the expected number of fish that are at the mid-level and from species C? Expected number =arrow_forwardi need help with this questionarrow_forward
- . Present a description of your variables: Provide a codebook with the following four columns: (1) Variable name; (2) Variable label; (3) Value & Value label and Level of measurement (i.e., nominal, ordinal, interval, ratio). Please present this as a table. This should fit on one page.arrow_forwardWe are interested in looking at the effect of a baseball player’s free agent status on their salary. We look at 337 baseball players and categorize them as either having a high salary (above 2 million) or not, and as either being free agents or not. ------------------------------ You also wonder if having a high batting average affects the salary of baseball players. You classify all 370 baseball players as having a high batting average if it is over .300. 1. The given χ2test table gives many test statistics. The row we want to look at is labeled Pearson Chi-Square. Give the test statistic, the degrees of freedom, and the p-value. 2. At a significance level of .05, what can you conclude in the context of this problem?arrow_forward
arrow_back_ios
arrow_forward_ios
Recommended textbooks for you
 MATLAB: An Introduction with ApplicationsStatisticsISBN:9781119256830Author:Amos GilatPublisher:John Wiley & Sons Inc
 Probability and Statistics for Engineering and th...StatisticsISBN:9781305251809Author:Jay L. DevorePublisher:Cengage Learning
 Statistics for The Behavioral Sciences (MindTap C...StatisticsISBN:9781305504912Author:Frederick J Gravetter, Larry B. WallnauPublisher:Cengage Learning
 Elementary Statistics: Picturing the World (7th E...StatisticsISBN:9780134683416Author:Ron Larson, Betsy FarberPublisher:PEARSON
 The Basic Practice of StatisticsStatisticsISBN:9781319042578Author:David S. Moore, William I. Notz, Michael A. FlignerPublisher:W. H. Freeman
 Introduction to the Practice of StatisticsStatisticsISBN:9781319013387Author:David S. Moore, George P. McCabe, Bruce A. CraigPublisher:W. H. Freeman

MATLAB: An Introduction with Applications
Statistics
ISBN:9781119256830
Author:Amos Gilat
Publisher:John Wiley & Sons Inc

Probability and Statistics for Engineering and th...
Statistics
ISBN:9781305251809
Author:Jay L. Devore
Publisher:Cengage Learning

Statistics for The Behavioral Sciences (MindTap C...
Statistics
ISBN:9781305504912
Author:Frederick J Gravetter, Larry B. Wallnau
Publisher:Cengage Learning

Elementary Statistics: Picturing the World (7th E...
Statistics
ISBN:9780134683416
Author:Ron Larson, Betsy Farber
Publisher:PEARSON

The Basic Practice of Statistics
Statistics
ISBN:9781319042578
Author:David S. Moore, William I. Notz, Michael A. Fligner
Publisher:W. H. Freeman

Introduction to the Practice of Statistics
Statistics
ISBN:9781319013387
Author:David S. Moore, George P. McCabe, Bruce A. Craig
Publisher:W. H. Freeman