ENGR.ECONOMIC ANALYSIS
14th Edition
ISBN: 9780190931919
Author: NEWNAN
Publisher: Oxford University Press
expand_more
expand_more
format_list_bulleted
Question

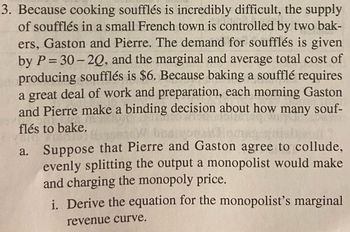
Transcribed Image Text:3. Because cooking soufflés is incredibly difficult, the supply
of soufflés in a small French town is controlled by two bak-
ers, Gaston and Pierre. The demand for soufflés is given
by P=30-20, and the marginal and average total cost of
producing soufflés is $6. Because baking a soufflé requires
a great deal of work and preparation, each morning Gaston
and Pierre make a binding decision about how many souf-
flés to bake.
HomW buanolinmas-gitalprof
a. Suppose that Pierre and Gaston agree to collude,
evenly splitting the output a monopolist would make
and charging the monopoly price.
i. Derive the equation for the monopolist's marginal
revenue curve.

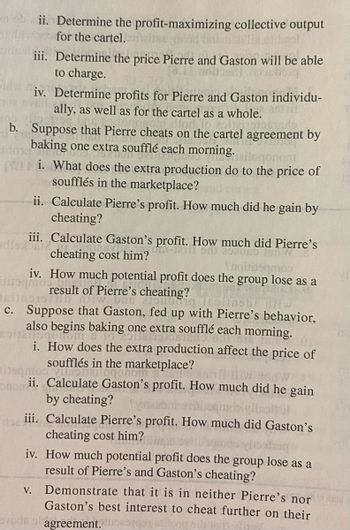
Transcribed Image Text:On obii. Determine the
for the cartel..
profit-maximizing
nebyl
iii. Determine the price Pierre and Gaston will be able
to charge.
collective output
host
iv. Determine profits for Pierre and Gaston individu-
ally, as well as for the cartel as a whole.
b. Suppose that Pierre cheats on the cartel agreement by
baking one extra soufflé each morning.
JORTE
Shailogonem
i. What does the extra production do to the price of
soufflés in the marketplace?
ii. Calculate Pierre's profit. How much did he gain by
cheating?
iii. Calculate Gaston's profit. How much did Pierre's
dla obiec
cheating cost him?
202080 Br
V.
Ynoinsamos
iv. How much potential profit does the group lose as a
Disamosto
result of Pierre's cheating?
01511D
c. Suppose that Gaston, fed up with Pierre's behavior,
also begins baking one extra soufflé each morning.
Halogo.com s
i. How does the extra production affect the price of
soufflés in the marketplace?
100
tre an
onom
ii. Calculate Gaston's profit. How much did he gain
by cheating?
THE
iii.
Calculate Pierre's profit. How much did Gaston's
cheating cost him?
iv.
How much potential profit does the group lose as a
result of Pierre's and Gaston's cheating?
Demonstrate that it is in neither Pierre's nor
Gaston's best interest to cheat further on their
vode el agreement.es
Expert Solution
This question has been solved!
Explore an expertly crafted, step-by-step solution for a thorough understanding of key concepts.
This is a popular solution
Trending nowThis is a popular solution!
Step by stepSolved in 6 steps

Knowledge Booster
Learn more about
Need a deep-dive on the concept behind this application? Look no further. Learn more about this topic, economics and related others by exploring similar questions and additional content below.Similar questions
- 3. Profit maximization using total cost and total revenue curves Suppose Bob runs a small business that manufactures teddy bears. Assume that the market for teddy bears is a competitive market, and the market price is $25 per teddy bear. The following graph shows Bob's total cost curve. Use the blue points (circle symbol) to plot total revenue and the green points (triangle symbol) to plot profit for teddy bears quantities zero through seven (inclusive) that Bob produces. TOTAL COST AND REVENUE (Dollars) 200 175 150 125 100 75 50 25 0 -25 O ☐ ☐ 0 1 2 3 4 5 QUANTITY (Teddy bears) ☐ 6 Total Cost 7 8 O Total Revenue Profit ?arrow_forwardHello, this is a microeconomics question. Please use a drawing of a relevant graph to explain how does perfect competition ensure allocative efficiency? Not sure if I'm supposed to use this graph, but if i am please use it as reference when making your explantion to the question of how does perfect competition ensure allocative efficiencyarrow_forwardDiscuss economies of scale and how average cost changes as output increases. What pricing strategy should a firm adopt while they are experiencing economies of scale? 250 words pleasearrow_forward
- What is an example of another business that stays open even when it's slow, and its revenue does not seem like it could cover its costs? Use microeconomics terms to explainarrow_forwardShow what happens in the short run on both graphs when a new medical study shows soybeans to be highly carcinogenic. On the market graph, you will shift a curve or curves. On the firm's graph, use Price 2 to draw a new price line for the firm. On both graphs, indicate the new equilibrium point with point B. Now, show the changes that get both graphs back to long‑run equilibrium. Use shift(s) for the market and Price 3 for the firm. Indicate the new long‑run equilibrium with point C.arrow_forwardSay the market demand coming from consumers is P = 40 - Q. Say firm 1 has total cost TC1 = Q1+ Q1^2, where Q1 is the Q for firm one, and similarly for firm 2 TC2 = 4Q2 + 0.5Q2^2. In each scenario below show your work and say what is total Q in market market price the Q of each firm and the profit of each firm: The scenarios are the firms compete as if in perfect competition the firms form a cartel the firms act as Cournot Duopolists.arrow_forward
- Help solving the tablearrow_forwardExplain the gains from trade that arise for both buyers and sellers in the following transactions: a. Neighbors Jordan and Chelsea are both working parents. They are able to hire a single babysitter to care for both of their toddlers for 75% of what they would collectively have to pay two separate babysitters. b. Elijah decides that his family should eat more healthy meals, but they are short on time. He buys a subscription that sends healthy preplanned meals to his home three times a week. c. Callie accepts an extra shift at work and hires a cleaning service to clean her apartment.arrow_forwardAttempts: Average: 12 5. Profit maximization and shutting down in the short run Suppose that the market for sports watches is a competitive market. The following graph shows the daily cost curves of a firm operating in this market. V ATC AVC PRICE (Dolars per watch) 100 5 MO 0 0 10 20 30 40 50 60 70 80 90 100 QUANTITY(Thousands of watches) For each price in the following table, calculate the firm's optimal quantity of units to produce, and determine the profit or loss if it produces at that quantity, using the data from the previous graph to identify its total variable cost. Assume that if the firm is indifferent between producing and shutting down, it will produce. (Hint: You can select the purple points [diamond symbols] on the previous graph to see precise information on average variable cost.) Price Quantity (Dollars per watch) (Watches) 25.00 40.00 65.00 Total Revenue Fixed Cost Variable Cost (Dollars) (Dollars) (Dollars) 520,000 $20,000 520,000 (Dollars) If the firm shuts down,…arrow_forward
arrow_back_ios
arrow_forward_ios
Recommended textbooks for you

 Principles of Economics (12th Edition)EconomicsISBN:9780134078779Author:Karl E. Case, Ray C. Fair, Sharon E. OsterPublisher:PEARSON
 Engineering Economy (17th Edition)EconomicsISBN:9780134870069Author:William G. Sullivan, Elin M. Wicks, C. Patrick KoellingPublisher:PEARSON
 Principles of Economics (MindTap Course List)EconomicsISBN:9781305585126Author:N. Gregory MankiwPublisher:Cengage Learning
 Managerial Economics: A Problem Solving ApproachEconomicsISBN:9781337106665Author:Luke M. Froeb, Brian T. McCann, Michael R. Ward, Mike ShorPublisher:Cengage Learning
 Managerial Economics & Business Strategy (Mcgraw-...EconomicsISBN:9781259290619Author:Michael Baye, Jeff PrincePublisher:McGraw-Hill Education


Principles of Economics (12th Edition)
Economics
ISBN:9780134078779
Author:Karl E. Case, Ray C. Fair, Sharon E. Oster
Publisher:PEARSON

Engineering Economy (17th Edition)
Economics
ISBN:9780134870069
Author:William G. Sullivan, Elin M. Wicks, C. Patrick Koelling
Publisher:PEARSON

Principles of Economics (MindTap Course List)
Economics
ISBN:9781305585126
Author:N. Gregory Mankiw
Publisher:Cengage Learning

Managerial Economics: A Problem Solving Approach
Economics
ISBN:9781337106665
Author:Luke M. Froeb, Brian T. McCann, Michael R. Ward, Mike Shor
Publisher:Cengage Learning

Managerial Economics & Business Strategy (Mcgraw-...
Economics
ISBN:9781259290619
Author:Michael Baye, Jeff Prince
Publisher:McGraw-Hill Education