
Videos
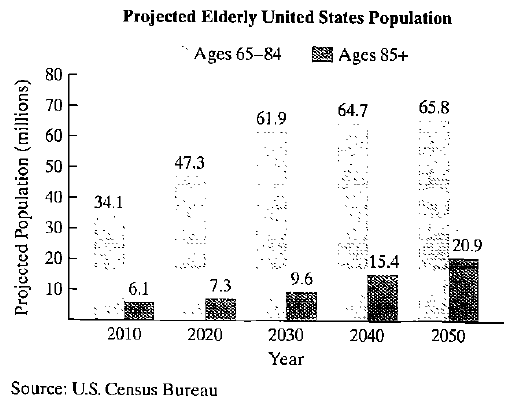
America is getting older. The graph shows thhe projected elderly U.S. population for ages 65–84 and for ages 85 and older.
The formula
a. Use the formula to find the projected increase in the number of Americans ages 65–84, in millions from 2020 to 2050. Express this difference in simplified radical form.
b. Use a calculator and write your answer in part (a) to the nearest tenth. Does this rounded decimal overestimate or underestimate the difference in the projected data shown by the bar graph on the previous page? By how much?
Want to see the full answer?
Check out a sample textbook solution
Chapter P Solutions
College Algebra


- World Military Expenditure The following chart shows total military and arms trade expenditure from 2011–2020 (t = 1 represents 2011). †A bar graph titled "World military expenditure" has a horizontal t-axis labeled "Year since 2010" and a vertical axis labeled "$ (billions)". The bar graph has 10 bars. Each bar is associated with a label and an approximate value as listed below. 1: 1,800 billion dollars 2: 1,775 billion dollars 3: 1,750 billion dollars 4: 1,730 billion dollars 5: 1,760 billion dollars 6: 1,760 billion dollars 7: 1,850 billion dollars 8: 1,900 billion dollars 9: 1,950 billion dollars 10: 1,980 billion dollars (a) If you want to model the expenditure figures with a function of the form f(t) = at2 + bt + c, would you expect the coefficient a to be positive or negative? Why? HINT [See "Features of a Parabola" in this section.] We would expect the coefficient to be positive because the curve is concave up. We would expect the coefficient to be negative because the…arrow_forwardIn Exercises 1–6, solve for x.arrow_forwardA city manage must predict the population of the city between the years 2000 and 2050 to make plans for new business expansions and housing developments. To determine the population growth, the city manager will use the formula y = ab x . What do the variables in this formula represent?arrow_forward
- A picture supposedly painted by Vermeer (1632–1675) contains 98.4% of its carbon-14 (half-life 5730 years). From this information decide whether the picture is a fake. Explain your reasoning.Round your answer to two decimal places.arrow_forwardEstimate using the change of base formula.arrow_forwardCell Phones Using the CTIA Wireless Survey for1985–2009, the number of U.S. cell phone subscribers (in millions) can be modeled byy = 0.632x2 - 2.651x + 1.209where x is the number of years after 1985.a. Graphically find when the number of U.S.subscribers was 301,617,000.b. When does the model estimate that the number ofU.S. subscribers would reach 359,515,000?c. What does the answer to (b) tell about this model?arrow_forward
 Algebra & Trigonometry with Analytic GeometryAlgebraISBN:9781133382119Author:SwokowskiPublisher:Cengage