
a
To plot:
Graphical representation of isoquant and quantity of K and L.
a
Explanation of Solution
Since q = 40,000 has been produced with
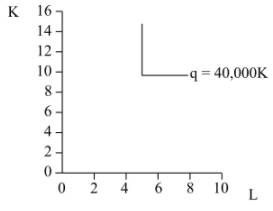
In the above diagram, x-axis measures labor while y-axis measures capital, q represents isoquant of Large Mowers as depicted above.
Introduction:
Isoquant curve is a graphical representation showing the same level of output production with different combinations of inputs.
b)
To plot:
Graphical function of isoquant for small mower.
b)
Explanation of Solution
This diagram shows the plotting of q = 40,000, K = 8 and L = 8
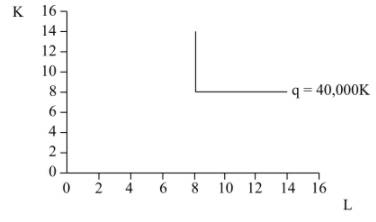
In the above diagram, x-axis measures labor while the y-axis measures capital. Q represents isoquant of Small Mowers as depicted above.
Introduction:
Expansion path is a combination of optimal output when input changes due to prices.
c)
To know:
Quantities of K and L for different lawn divisions.
c)
Explanation of Solution
Production functions are given below:
When lawn is cut by 1st method:
When lawn is cut by 2nd method:
Total capital requirement = 9
Total labor requirement = 6.5
Production functions are given below:
When lawn is cut by 1st method:
When lawn is cut by 2nd method:
Total capital requirement = 9.5
Total labor requirement = 5.75
The fraction of K and L means the amount of capital input used per unit of labor.
This table shows the resources uses in the Large Mowers and Small Mowers.
| 40,000 sq.ft. | LM | SM | ||
| LM/SM mix | L | K | L | K |
| 0/100$% | 0 | 0 | 8 | 8 |
| 25%/75% | 1.25 | 2.5 | 6 | 6 |
| 50%/50% | 2.5 | 5 | 4 | 4 |
| 75%/25% | 3.75 | 7.5 | 2 | 2 |
| 100%/0% | 5 | 10 | 0 | 0 |
Introduction:
Isoquant curve is a graphical representation showing the same level of output production with different combinations of inputs.
d)
To plot:
Graphical representation of isoquant.
d)
Explanation of Solution
Calculation of labor and capital when 40000 square foot of lawn is cut by 1st method with p fraction.
Calculation of labor and capital when (1-p) fraction of 40,000 square foot lawn is cut by 2nd method.
Calculation of labor requirement:
Calculation of total capital requirement:
Two equations are given as follows:
Solving first equation for p and putting the value of p in second as shown below:
The Table shows the different calculations of Labor (L) and capital (K) in Small Mowers as shown below:
| 40,000 sq.ft. | LM | |
| LM/SM mix | L | K |
| 0/100$% | 8 | 8 |
| 25%/75% | 7.25 | 8.5 |
| 50%/50% | 6.5 | 9 |
| 75%/25% | 5.75 | 9.5 |
| 100%/0% | 5 | 10 |
Following graph is plotted from the given table shows the isoquant for the combined production function as shown below:
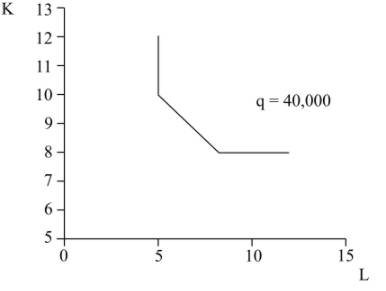
In the above diagram, x-axis measures labor while y-axis measures capital, q represents isoquant for the combined production function as depicted above.
Introduction:
Expansion path is a combination of optimal output when input changes due to prices.
Want to see more full solutions like this?
Chapter 9 Solutions
Microeconomic Theory

- Automobile manufacturing is an industry subject to significant economies of scale. Suppose there are four domestic auto manufacturers, but the demand for domestic autos is no more than 2.5 times the quantity produced at the bottom of the long-run average cost curve. What do you expect will happen to the domestic auto industry in the long run?arrow_forwardWhat is the difference between economies of scale, constant returns to scale, and diseconomies of scale?arrow_forward

 Essentials of Economics (MindTap Course List)EconomicsISBN:9781337091992Author:N. Gregory MankiwPublisher:Cengage Learning
 Exploring EconomicsEconomicsISBN:9781544336329Author:Robert L. SextonPublisher:SAGE Publications, Inc
 Principles of Economics 2eEconomicsISBN:9781947172364Author:Steven A. Greenlaw; David ShapiroPublisher:OpenStax
 Microeconomics: Principles & PolicyEconomicsISBN:9781337794992Author:William J. Baumol, Alan S. Blinder, John L. SolowPublisher:Cengage Learning