
(a)
| Y | C | I | G | X |
| $ 500 | $500 | $10 | $20 | $60 |
| $600 | $590 | $10 | $20 | $40 |
| $700 | $680 | $10 | $20 | $20 |
| $800 | $770 | $10 | $20 | $0 |
| $900 | $860 | $10 | $20 | -$20 |
| $1000 | $950 | $10 | $20 | -$40 |
The value of MPC.
Answer to Problem 6E
| Y | C | MPC |
| $500 | $500 | |
| $600 | $590 | 0.9 |
| $700 | $680 | 0.9 |
| $800 | $770 | 0.9 |
| $900 | $860 | 0.9 |
| $1000 | $950 | 0.9 |
Explanation of Solution
MPC =
Wherein, Change in Income =
| Y | C | MPC |
| $500 | $500 | |
| $600 | $590 | 0.9 |
| $700 | $680 | 0.9 |
| $800 | $770 | 0.9 |
| $900 | $860 | 0.9 |
| $1000 | $950 | 0.9 |
MPC − The additional consumption resulting from an additional unit of income.
(b)
To write:
| Y | C | I | G | X |
| $ 500 | $500 | $10 | $20 | $60 |
| $600 | $590 | $10 | $20 | $40 |
| $700 | $680 | $10 | $20 | $20 |
| $800 | $770 | $10 | $20 | $0 |
| $900 | $860 | $10 | $20 | -$20 |
| $1000 | $950 | $10 | $20 | -$40 |
The value of MPS.
Answer to Problem 6E
The value of MPS is 0.10.
Explanation of Solution
Since income can only be either consumed or saved, therefore it can be written as
Y = C+S
Differentiating both sides with respect to Y
1 =
Thus, MPS =
In this case,
MPS =
MPS = 0.1
MPS − The additional savings arising out of an additional unit of income.
(c)
| Y | C | I | G | X |
| $ 500 | $500 | $10 | $20 | $60 |
| $600 | $590 | $10 | $20 | $40 |
| $700 | $680 | $10 | $20 | $20 |
| $800 | $770 | $10 | $20 | $0 |
| $900 | $860 | $10 | $20 | -$20 |
| $1000 | $950 | $10 | $20 | -$40 |
The value of MPI.
Answer to Problem 6E
| Y | I |
| $ 500 | $10 |
| $600 | $10 |
| $700 | $10 |
| $800 | $10 |
| $900 | $10 |
| $1000 | $10 |
The MPI is zero.
Explanation of Solution
In this case, the investment is not changing with income level. It is fixed. Hence, the marginal propensity to invest is zero.
MPI − The additional investment arising out of an additional unit of income.
(d)
| Y | C | I | G | X |
| $ 500 | $500 | $10 | $20 | $60 |
| $600 | $590 | $10 | $20 | $40 |
| $700 | $680 | $10 | $20 | $20 |
| $800 | $770 | $10 | $20 | $0 |
| $900 | $860 | $10 | $20 | -$20 |
| $1000 | $950 | $10 | $20 | -$40 |
The aggregate expenditure at each level of income.
Answer to Problem 6E
| Y | C | I | G | X | AE |
| $ 500 | $500 | $10 | $20 | $60 | $590 |
| $600 | $590 | $10 | $20 | $40 | $660 |
| $700 | $680 | $10 | $20 | $20 | $730 |
| $800 | $770 | $10 | $20 | $0 | $800 |
| $900 | $860 | $10 | $20 | -$20 | $870 |
| $1000 | $950 | $10 | $20 | -$40 | $940 |
Explanation of Solution
Aggregate expenditure at each level of income is consumption expenditure plus investment expenditure plus government expenditure and net exports.
Aggregate expenditure− The expenditure made by different sectors of the economy to goods and services and the net exports.
(e)
| Y | C | I | G | X |
| $ 500 | $500 | $10 | $20 | $60 |
| $600 | $590 | $10 | $20 | $40 |
| $700 | $680 | $10 | $20 | $20 |
| $800 | $770 | $10 | $20 | $0 |
| $900 | $860 | $10 | $20 | -$20 |
| $1000 | $950 | $10 | $20 | -$40 |
The aggregate expenditure graphs.
Answer to Problem 6E
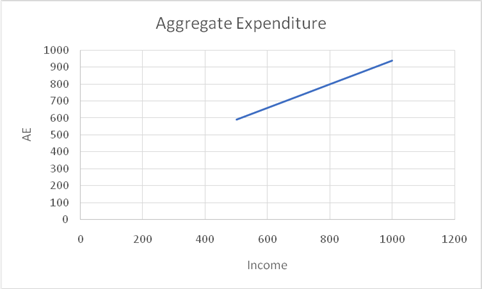
Explanation of Solution
Aggregate Expenditure graph will be sloping upwards. This is due to the increase in level of aggregate expenditure.
| Y | C | I | G | X | AE |
| $ 500 | $500 | $10 | $20 | $60 | $590 |
| $600 | $590 | $10 | $20 | $40 | $660 |
| $700 | $680 | $10 | $20 | $20 | $730 |
| $800 | $770 | $10 | $20 | $0 | $800 |
| $900 | $860 | $10 | $20 | -$20 | $870 |
| $1000 | $950 | $10 | $20 | -$40 | $940 |
Aggregate expenditure− The expenditure made by different sectors of the economy to goods and services and the net exports.
Want to see more full solutions like this?
Chapter 9 Solutions
Macroeconomics (MindTap Course List)

- Use the following information on economy X to answer the questions below.Consumption function: C = 250 + 0.8Y Investment spending: I = 150 Government spending: G = 500 Exports of goods and services: X = 200 Imports of goods and services: Z = 150 Proportional tax rate: t =25%Full employment level of income = 3575 1. Calculate total autonomus spending for economy X. 2. Calculate the multiplier for economy X.arrow_forwardWhat is the aggregate expenditures function?arrow_forwardUse the following information on economy X to answer the questions below.Consumption function: C = 250 + 0.8YInvestment spending: I = 150Government spending: G = 500Exports of goods and services: X = 200Imports of goods and services: Z = 150Proportional tax rate: t =25%Full employment level of income = 3575Q.4.1.4 Calculate the change in government spending required to reach full employment level of income.arrow_forward
- Use the graph to answer the questions that follow. a.What is the value of the MPC?b.What is the value of the MPS?c.What is the value of the multiplier?d.What is the amount of unplanned investment at aggregateoutput of 300, 900, and 1,300?arrow_forwardExplain the concept of the spending multiplier.arrow_forwardUse the following information on economy X to answer the questions below. Consumption function: C = 250 + 0.8Y Investment spending: I = 150 Government spending: G = 500 Exports of goods and services: X = 200 Imports of goods and services: Z = 150 Proportional tax rate: t =25% Full employment level of income = 3575 a) Calculate total autonomus spending for economy X. b) Calculate the multiplier for economy X. c) Calculate the equilibrium income for the economy. d) Calculate the change in government spending required to reach full employment level of income.arrow_forward
- Use the following information on economy X to answer the questions below.Consumption function: C = 250 + 0.8Y Investment spending: I = 150 Government spending: G = 500 Exports of goods and services: X = 200 Imports of goods and services: Z = 150 Proportional tax rate: t =25%Full employment level of income = 3575 1. Calculate the equilibrium income for the economy. 2. Calculate the change in government spending required to reach (3) full employment level of income.arrow_forwardWhat are the four categories of aggregate expenditure (demand)? Give an example of each. 9.1 Calculate the Marginal Propensity to Consume and the Marginal Propensity to Save. Fill in the blanks in the following table. Show that the MPC plus the MPS equals 1. National Income & Real GDP (Y) Consumption (C) Saving (S) MPC MPS $9,000 $8,000 $10,000 $8,600 $11,000 $9,200 $12,000 $9,800 $13,000 $10,400arrow_forwardUse the diagram to the right to answer the following: a. The equilibrium value of real GDP is $ trillion. (Enter your response as a whole number.) b. The MPC is equal to (Enter your response rounded to two decimal places.) c. The multiplier is equal to (Enter your response rounded to one decimal place.) d. What is the value of unplanned changes in inventories when real GDP has each of the following values? (Enter your responses rounded to one decimal place and include a minus sign if necessary.) GDP $10 trillion $12 trillion $14 trillion Unplanned Inventories trillion trillion trillion C Aggregate Expenditure, AE ($, trillions) 24.0- 22.0 ≈ ≈ ¦ CO 20.0- 18.0- 16.0- 14.0- 12.0+ 10.0- 8.0- 6.0- 4.0- 2.0- 0.0- O. 13.6 12.0 10.4 0 45° -~ 2 4 AE 10:12:14 10 12 14 16 18 20 22 24 6 8 Real GDP, Y ($, trillions) Garrow_forward
- Explain the basic idea of the expenditure multiplier and the role consumers' play.arrow_forwardTrue or False. If spending exceeds output, real GDP will decline as firms cut back on production.arrow_forwardBelow is some data for a hypothetical economy: C = -232 + 0.8Y XN = 107 - 0.1Y I = 100 T = 340 G = 340 Refer to the information above to answer this question What is the equation for aggregate expenditures? a. AE = 547 + 0.9Y b. AE = 315 + 0.7Y c. AE = 440 + 0.9Y d. AE = 440 + 0.7Yarrow_forward
