
Fundamentals of Financial Management, Concise Edition (with Thomson ONE - Business School Edition, 1 term (6 months) Printed Access Card) (MindTap Course List)
8th Edition
ISBN: 9781285065137
Author: Eugene F. Brigham, Joel F. Houston
Publisher: Cengage Learning
expand_more
expand_more
format_list_bulleted
Videos
Textbook Question
Chapter 8, Problem 4DQ
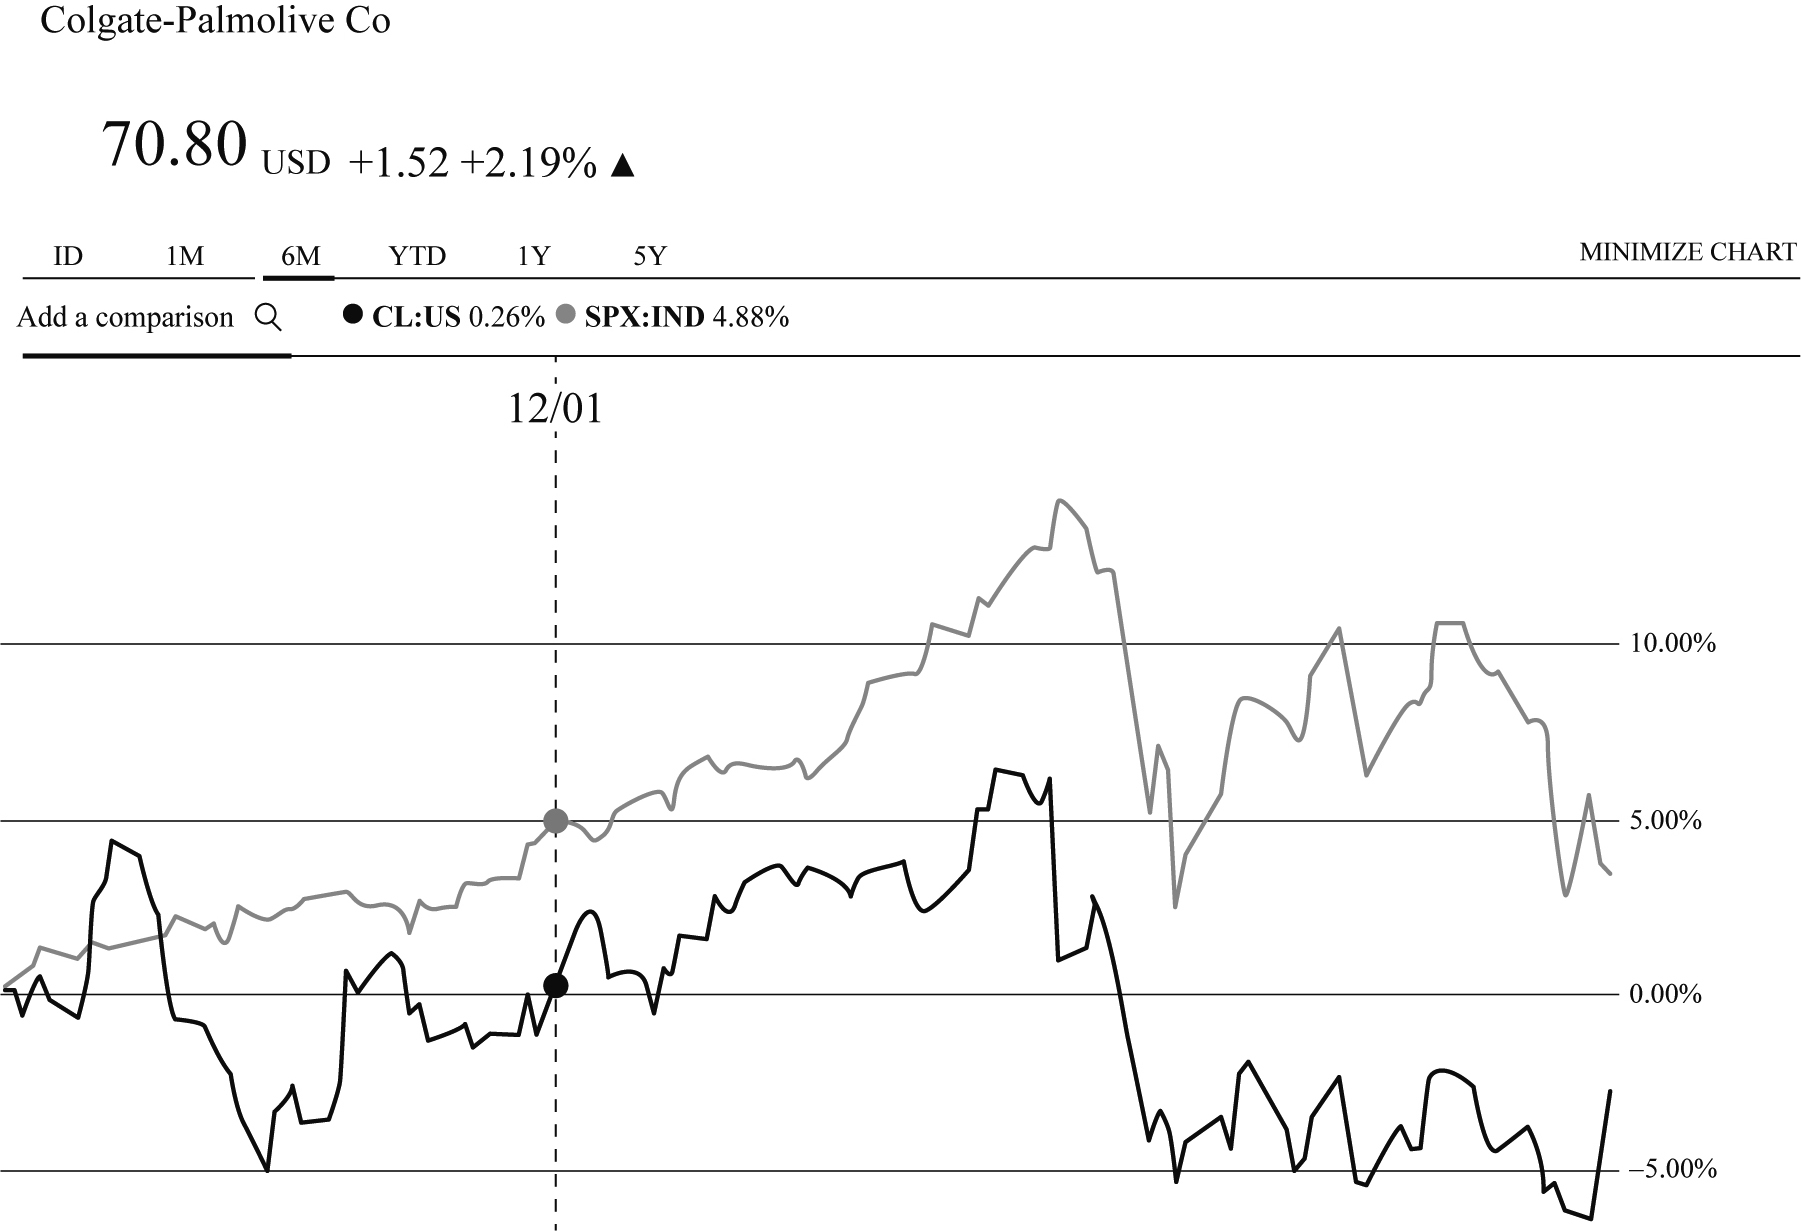
Select one of the four stocks listed in Question 3 by entering the company’s ticker symbol on the financial website you have chosen. On the screen you should see the interactive chart. Select the six-month time period and select the S&P 500, so the stock’s performance will be compared to the S&P 500’s performance on the graph. Has the stock outperformed or underperformed the overall market during this time period?
Expert Solution & Answer
Want to see the full answer?
Check out a sample textbook solution
Students have asked these similar questions
Using the data in the following table,, estimate the:
a. Average return and volatility for each stock.
b. Covariance between the stocks.
c. Correlation between these two stocks.
a. Estimate the average return and volatility for each stock.
The average return of stock A is
%. (Round to two decimal places.)
Data table
(Click on the following icon in order to copy its contents into a spreadsheet.)
Year
Stock A
2010
2011
2012
2013
2014
2015
- 1%
6%
2%
-5%
4%
6%
Stock B
20%
9%
8%
-3%
- 5%
21%
Print
Done
☑
Clear
How do i use the following data to construct a stock bar chart for the 5 day period?
Please explain the price movements of each stock's DIS AND WFC from the past three months. Do the calculations on the spreadsheet show that the company's stock went up or down? Why? Demonstrate a clear understanding of the concept beta of each stock.
Chapter 8 Solutions
Fundamentals of Financial Management, Concise Edition (with Thomson ONE - Business School Edition, 1 term (6 months) Printed Access Card) (MindTap Course List)
Ch. 8 - Suppose you owned a portfolio consisting of...Ch. 8 - Prob. 2QCh. 8 - Prob. 3QCh. 8 - Is it possible to construct a portfolio of...Ch. 8 - Stock A has an expected return of 7%, a standard...Ch. 8 - A stock had a 12% return last year, a year when...Ch. 8 - If investors aversion to risk increased, would the...Ch. 8 - Prob. 8QCh. 8 - In Chapter 7, we saw that if the market interest...Ch. 8 - Prob. 1P
Ch. 8 - PORTFOLIO BETA An individual has 35,000 invested...Ch. 8 - REQUIRED RATE OF RETURN Assume that the risk-free...Ch. 8 - EXPECTED AND REQUIRED RATES OF RETURN Assume that...Ch. 8 - Prob. 5PCh. 8 - EXPECTED RETURNS Stocks X and Y have the following...Ch. 8 - PORTFOLIO REQUIRED RETURN Suppose you are the...Ch. 8 - BETA COEFFICIENT Given the following information...Ch. 8 - REQUIRED RATE OF RETURN Stock R has a beta of 1.5,...Ch. 8 - Prob. 10PCh. 8 - CAPM AND REQUIRED RETURN Calculate the required...Ch. 8 - REQUIRED RATE OF RETURN Suppose rRF = 9%, rM = 14%...Ch. 8 - CAPM, PORTFOLIO RISK. AND RETURN Consider the...Ch. 8 - Prob. 14PCh. 8 - CAPM AND REQUIRED RETURN HR Industries (HRI) has a...Ch. 8 - CAPM AND PORTFOLIO RETURN You have been managing a...Ch. 8 - PORTFOLIO BETA A mutual fund manager has a 20...Ch. 8 - EXPECTED RETURNS Suppose you won the lottery and...Ch. 8 - EVALUATING RISK AND RETURN Stock X has a 10%...Ch. 8 - Prob. 20PCh. 8 - SECURITY MARKET LINE You plan to invest in the...Ch. 8 - Prob. 22SPCh. 8 - Prob. 23ICCh. 8 - Prob. 1DQCh. 8 - Prob. 2DQCh. 8 - Prob. 3DQCh. 8 - Select one of the four stocks listed in Question 3...Ch. 8 - Go back to the summary page to see an estimate of...Ch. 8 - Prob. 6DQCh. 8 - Prob. 7DQCh. 8 - Beta pf CPB company Beta of the MSI Company is...
Knowledge Booster


Learn more about
Need a deep-dive on the concept behind this application? Look no further. Learn more about this topic, finance and related others by exploring similar questions and additional content below.Similar questions
- Using the data in the following table,, estimate the: a. Average return and volatility for each stock. b. Covariance between the stocks. c. Correlation between these two stocks. a. Estimate the average return and volatility for each stock. The average return of stock Ais %. (Round to two decimal places.) Data table (Click on the following icon in order to copy its contents into a spreadsheet.) Year 2010 2011 2013 Stock A - 5% 17% - 6% Stock B 29% 21% - 1% 2012 7% 4% 2014 1% - 15% 2015 13% 20%arrow_forwardThe company stock ticker symbol is PTC. Discuss the past performance of the stock (such as historical trading range). Illustrate with at least two charts of prices over time: one for long term (>= 1 year) and one for short term (<1 year). Also discuss briefly both the overall long term and short-term performance/price behavior.arrow_forwardUsing the data in the following table, calculate the return for investing in the stock from January 1 to December 31. Prices are after the dividend has been paid. The realized return for the entire period is%. (Round to two decimal places.) Data table (Click on the following icon in order to copy its contents into a spreadsheet.) Stock and Dividend Data Price $31.49 $29.52 $30.58 $31.41 $36.79 $43.08 Date Jan 1 Feb 5 May 14 Aug 13 Nov 12 Dec 31 Dividend $0.17 $0.22 $0.21 $0.21 - Xarrow_forward
- Your friend is thinking about buying shares of stock in a company. You have been tracking the closing prices of the stock shares for the past 90 trading days. Which type of graph for the data, histogram or time-series, would be best to show your friend? Why? A. A time-series graph because the pattern of stock prices over time is more relevant than the frequency of a range of closing prices. B. A time-series graph because the pattern of stock prices over time is less relevant than the frequency of a range of closing prices. C. A histogram because the pattern of stock prices over time is less relevant than the frequency of a range of closing prices. D. A histogram because the pattern of stock prices over time is more relevant than the frequency of a range of closing prices.arrow_forwardThe following are the end-of-month prices for both the Standard & Poor's 500 Index and Nike's common stock. a. Using the data in the popup window, calculate the holding-period returns for each of the months. b. Calculate the average monthly return and the standard deviation for both the S&P 500 and Nike. c. Develop a graph that shows the relationship between the Nike stock returns and the S&P 500 Index. (Show the Nike returns on the vertical axis and the S&P 500 Index returns on the horizontal axis.) d. From your graph, describe the nature of the relationship between Nike stock returns and the returns for the S&P 500 Index.arrow_forwardPlease explain the price movements of each stock's DIS AND WFC from the past three months shown in the spreadsheet. Demonstrate a clear understanding of the concept beta of each stock.arrow_forward
- Using the data in the following table,, estimate the: a. Average return and volatility for each stock. b. Covariance between the stocks. c. Correlation between these two stocks. a. Estimate the average return and volatility for each stock. The average return of stock A is %. (Round to two decimal places.) Data table (Click on the following icon in order to copy its contents into a spreadsheet.) Year 2010 2011 20% 2013 - 1% - 13% Stock A Stock B 20% 12% - 9% Print 2012 8% 9% C Done 2014 4% - 9% 2015 11% 27% - Xarrow_forwardUsing the data in the following table, calculate the return for investing in Boeing stock (BA) from January 2, 2008, to January 2, 2009, and also from January 3, 2011, to January 3, 2012, assuming all dividends are reinvested in the stock immediately. The realized return from January 2, 2008, to January 2, 2009 is %. (Round to two decimal places.) Data table (Click on the following icon in order to copy its contents into a spreadsheet.) Historical Stock and Dividend Data for Boeing Dividend Date 1/3/2011 2/9/2011 5/11/2011 8/10/2011 11/8/2011 1/3/2012 Date 1/2/2008 2/6/2008 5/7/2008 8/6/2008 11/5/2008 1/2/2009 Price $84.35 $80.07 $85.71 $63.71 $47.44 $44.97 $0.39 $0.39 $0.39 $0.00 Print Done Price $66.08 $72.91 $78.83 $55.86 $64.37 $75.65 Dividend $0.41 $0.41 $0.41 $0.41 Xarrow_forwardUsing the data in the following table, calculate the return for investing in the stock from January 1 to December 31. Prices are after the dividend has been paid The realized return for the entire period is% (Round to two decimal places.) Data table (Click on the following icon in order to copy its contents into a spreadsheet.) Stock and Dividend Data Price $32,74 $29.75 $29.19 $32.13 $36.55 $40 64 Date Jan 1 Feb 5 May 14 Aug 13 Nov 12 Dec 31 k Print Done Dividend $0.21 $0.21 $0.22 $0.18 - Xarrow_forward
- Using Microsoft Office / Excel 365 STOCKHISTORY and FORECASTING functions available, prepare a line graph of the weekly share price history (from 1/7/2022 to 31/3/2024) for any two (2) listed companies that you have been allocated (separate graphs). Forecast the share price for the next 6 months (i.e ., 30/9/2024). Please note, graphs should also include a trendline and formula. Predicted weekly share price figures should be shown using the FORECAST SHEET function or FORECAST formula function available.arrow_forwardThe annual rate of return on any given stock can be found as the stock's dividend for the year plus the change in the stock's price during the year, divided by its beginning-of-year price. If you obtain such data on a large portfolio of stocks, like those in the S&P 500, find the rate of return on each stock, and then average those returns, this would give you an idea of stock market returns for the year in question. true/falsearrow_forwardUsing the data in the following table,, calculate the return for investing in Boeing stock (BA) from January 2, 2008, to January 2, 2009, and also from January 3, 2011, to January 3, 2012, assuming all dividends are reinvested in the stock immediately. The realized return from January 2, 2008, to January 2, 2009 is%. (Round to two decimal places.) Data table (Click on the following icon in order to copy its contents into a spreadsheet.) Dividend Historical Stock and Dividend Data for Boeing Date 1/3/2011 2/9/2011 5/11/2011 8/10/2011 11/8/2011 1/3/2012 Date 1/2/2008 2/6/2008 5/7/2008 8/6/2008 11/5/2008 1/2/2009 Price $84.12 $77.43 $83.47 $64.69 $49.19 $44.46 $0.37 $0.37 $0.37 $0.00 Print Done Price $66.31 $72.71 $78.82 $56.87 $64.67 $73.36 Dividend $0.41 $0.41 $0.41 $0.41 - Xarrow_forward
arrow_back_ios
SEE MORE QUESTIONS
arrow_forward_ios
Recommended textbooks for you
 Fundamentals of Financial Management, Concise Edi...FinanceISBN:9781285065137Author:Eugene F. Brigham, Joel F. HoustonPublisher:Cengage Learning
 Fundamentals of Financial Management, Concise Edi...FinanceISBN:9781305635937Author:Eugene F. Brigham, Joel F. HoustonPublisher:Cengage Learning
 Fundamentals Of Financial Management, Concise Edi...FinanceISBN:9781337902571Author:Eugene F. Brigham, Joel F. HoustonPublisher:Cengage Learning
 Essentials Of Business AnalyticsStatisticsISBN:9781285187273Author:Camm, Jeff.Publisher:Cengage Learning,
Fundamentals of Financial Management, Concise Edi...
Finance
ISBN:9781285065137
Author:Eugene F. Brigham, Joel F. Houston
Publisher:Cengage Learning
Fundamentals of Financial Management, Concise Edi...
Finance
ISBN:9781305635937
Author:Eugene F. Brigham, Joel F. Houston
Publisher:Cengage Learning
Fundamentals Of Financial Management, Concise Edi...
Finance
ISBN:9781337902571
Author:Eugene F. Brigham, Joel F. Houston
Publisher:Cengage Learning
Essentials Of Business Analytics
Statistics
ISBN:9781285187273
Author:Camm, Jeff.
Publisher:Cengage Learning,
Investing For Beginners (Stock Market); Author: Daniel Pronk;https://www.youtube.com/watch?v=6Jkdpgc407M;License: Standard Youtube License