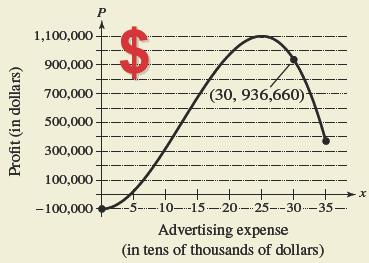
HOW DO YOU SEE IT? The graph below shows a company’s estimated profits for different advertising expenses. The company’s actual profit was $ 936 , 660 for an advertising expense of $ 300 , 000. (a) From the graph, it appears that the company could have obtained the same profit for a lesser advertising expense. Use the graph to estimate this expense. (b) The company’s model is P = – 140.75 x 3 + 5348.3 x 2 – 76 , 560 , 0 ≤ x ≤ 35 where P is the profit (in dollars) and x is the advertising expense (in tens of thousands of dollars).Explain how you could verify the lesser expense from part (a) algebraically.
HOW DO YOU SEE IT? The graph below shows a company’s estimated profits for different advertising expenses. The company’s actual profit was $ 936 , 660 for an advertising expense of $ 300 , 000. (a) From the graph, it appears that the company could have obtained the same profit for a lesser advertising expense. Use the graph to estimate this expense. (b) The company’s model is P = – 140.75 x 3 + 5348.3 x 2 – 76 , 560 , 0 ≤ x ≤ 35 where P is the profit (in dollars) and x is the advertising expense (in tens of thousands of dollars).Explain how you could verify the lesser expense from part (a) algebraically.
Solution Summary: The author analyzes how the company's profit at an advertising expense is 936,660 — the same profit also occurs at a lesser expense.
HOW DO YOU SEE IT? The graph below shows a company’s estimated profits for different advertising expenses. The company’s actual profit was
$
936
,
660
for an advertising expense of
$
300
,
000.
(a) From the graph, it appears that the company could have obtained the same profit for a lesser advertising expense. Use the graph to estimate this expense.
(b) The company’s model is
P
=
–
140.75
x
3
+
5348.3
x
2
–
76
,
560
,
0
≤
x
≤
35
where
P
is the profit (in dollars) and
x
is the advertising expense (in tens of thousands of dollars).Explain how you could verify the lesser expense from part (a) algebraically.
A box is formed by cutting squares from the four corners of a sheet of paper and folding up the sides. The graph
below shows how the volume of the box in cubic inches, V, is related to the length of the side of the square cutout in
inches, x.
(1.7, 81.87)
V
a. The point (1.25, 77.188) is on the graph. This means that when the volume of the box is
cubic
inches, the cutout length is
inches.
b. When the cutout length is 3 inches, the volume of the box is 54 cubic inches. This means that the point
is on the graph above.
c. Suppose the largest possible cutout length is 4.5 inches. Over what interval of x does the volume of the box
decrease as the cutout length gets larger? (Enter your answer as an interval.)
Preview
Help! I'm just asking how to graph the table shown in the picture. Nothing else.
The Sugar Sweet Company needs to transport sugar to market. The graph
below shows the transporting cost (in dollars) versus the weight of the
sugar being transported (in tons).
Use the graph to answer the questions.
Need a deep-dive on the concept behind this application? Look no further. Learn more about this topic, algebra and related others by exploring similar questions and additional content below.


 Algebra: Structure And Method, Book 1AlgebraISBN:9780395977224Author:Richard G. Brown, Mary P. Dolciani, Robert H. Sorgenfrey, William L. ColePublisher:McDougal Littell
 Algebra & Trigonometry with Analytic GeometryAlgebraISBN:9781133382119Author:SwokowskiPublisher:Cengage
 Algebra and Trigonometry (MindTap Course List)AlgebraISBN:9781305071742Author:James Stewart, Lothar Redlin, Saleem WatsonPublisher:Cengage Learning
 Elementary AlgebraAlgebraISBN:9780998625713Author:Lynn Marecek, MaryAnne Anthony-SmithPublisher:OpenStax - Rice University