
Relation between the inflation and the fund made up of precious metals.
Explanation of Solution
The precious metals include gold, silver, platinum, and others in the economy. The fund made up of these metals is traditionally known as the best measure against the inflation. If the assumption is true, there will be a strong positive relationship between the inflation rate and the demand for funds made up of precious metals. In order to see the relation between the two, the monthly
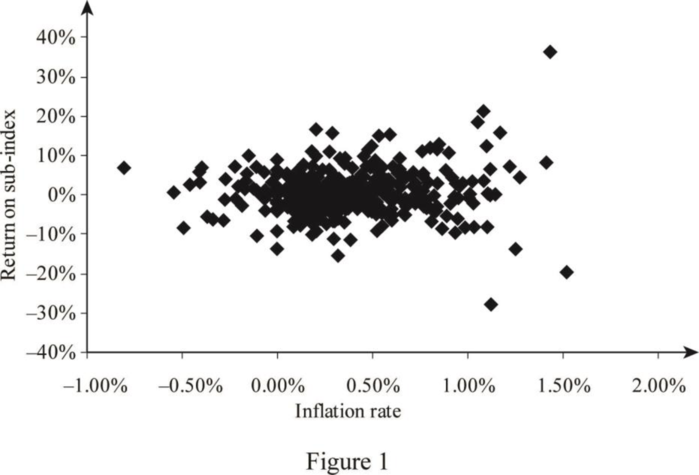
Through analyzing the pattern of the plots, it shows that there is no linear relationship identified between the inflation rate in the economy and the demand for the fund made up of precious metals.
Scatter diagram: The scatter diagram is a graphical representation of values of two variables plotted along the two axes. The pattern between the resulting plotted points reveals whether there is any relation between the two variables or not.
Want to see more full solutions like this?
Chapter 3 Solutions
Statistics for Management and Economics (Book Only)

- The following table shows the annual inflation rate (the GDP deflator) of Japan, the UK, China, and South Sudan in the period 1996-2015 (Source World Bank 1996-2000 2001-2005 2006-2010 2011-2015 -1.9% -0.9% Japan UK -0.5% 1.6% 2.1% 1.7% 1.8% 1.8% China 8.1% 2.4% 2.1% 0.8% South Sudan 54.1% 6.5% 0.6% -18.7% Based on this information, which of the following statements is correct? O In Sudan Price level has always decreased between 1996 and 2015 The general price level decreased in China between 1996 and 2015 O China experienced disinflation between 1996 and 2015 O in the UK, the price of goods and services remained stable between 2001 and 2015arrow_forwardThe CPI in 2020 was 136.2 and the CPI in 2021 was 140.1. The rate of inflation between 2020 and 2021 was approximately 3.7% was approximately 2.7% was approximately 3.9% cannot be determined from this information because the base year is unknown was approximately 2.9%arrow_forwardAccording to the price index, it costs 200 dollars to buy a typical basket of goods in one year. However, it costs 220 dollars in the following year. What is the inflation rate? Group of answer choices Not enough information. We need to know interest rates. 9% 10% 12%arrow_forward
- The values of nominal prices of a good at the end of each year between 2016 and 2019 (with 2016 being the base year) are listed in the table which also shows the annual rates of inflation: 2016 150 Inflation 5% Year Price 2017 158 x% 2019 179 z% 2018 170 y% where x, y, z are the last three digits of your student code (for example: if a student code is 17071435 then x = 4, y = 3, z = 5). a/ If the index number of the real price for 2020 is 105 and the rate of inflation for this year is 6%, work out the value of nominal price in 2020; b/ If the index number of the nominal price for 2015 is 90, work out the value of real price in 2015.arrow_forwardSuppose the inflation rate was 3% last year and is 1.5% this year. This means that Group of answer choices all prices rose 3% this year. on average, prices fell between last year and this year. on average, prices rose more slowly between last year and this year. all prices rose by 1.5% this year.arrow_forwardStudy the associated figure. Adjusted for inflation, during which years during the period shown did the lowest gasoline prices occur? A) Gas was cheapest in 1998 - 1999 because the graph shows that the actual price of a gallon of gas was at its lowest in that time period. B) Gas was cheapest in 1998 - 1999 because the graph shows that the price of a gallon of gas in 2016 dollars was at its lowest in that time period. C) Gas was cheapest in 1980 - 1982 because the graph shows that the price of a gallon of gas in 2016 dollars was at its lowest in that time period. D) Gas was cheapest in 1950 - 1952 because the graph shows that the price of a gallon of gas in 2016 dollars was at its lowest in that time period.arrow_forward
- If the CPI in 2011 was 136.6, determine the purchasing power of the dollar compared with the base year 2002 (CPI = 100).arrow_forwardAssume that the retail price index (RPI) for the UK was 100 in January 1950 and 3246 in January 2015. Calculate the average annual inflation rate.arrow_forwardAn agent of a real state company stated that a house he sold in 1980 for $37000 was sold by the buyer for $90000 in 1990. If the increase in price is due to inflation, determine the average rate of inflation between 1980 and 1990.arrow_forward
- Below is a list of annual CPI values for the years 2000-2003. Using these values please calculate the average annual rate of inflation over this period. Table Year CPI 2000 200.2 2001 205.6 2002 208.2 2003 209.1 4.45% 1.46% 2.97%arrow_forwardA certain country calculates inflation using a consumer price index (CPI). Between 2016 and 2017 the CPI increased from 200 to 220. What was the inflation rate between 2016 and 2017? 110% 10% 20 20%arrow_forward(i)Given that 2019 is the base year, calculate the CPI for 2020 and determine the inflation rate between 2019 and 2020. (ii)Provide two reasons that the CPI may not reflect the actual cost of living of households accurately.arrow_forward

 Principles of Economics (12th Edition)EconomicsISBN:9780134078779Author:Karl E. Case, Ray C. Fair, Sharon E. OsterPublisher:PEARSON
 Engineering Economy (17th Edition)EconomicsISBN:9780134870069Author:William G. Sullivan, Elin M. Wicks, C. Patrick KoellingPublisher:PEARSON
 Principles of Economics (MindTap Course List)EconomicsISBN:9781305585126Author:N. Gregory MankiwPublisher:Cengage Learning
 Managerial Economics: A Problem Solving ApproachEconomicsISBN:9781337106665Author:Luke M. Froeb, Brian T. McCann, Michael R. Ward, Mike ShorPublisher:Cengage Learning
 Managerial Economics & Business Strategy (Mcgraw-...EconomicsISBN:9781259290619Author:Michael Baye, Jeff PrincePublisher:McGraw-Hill Education