
b)
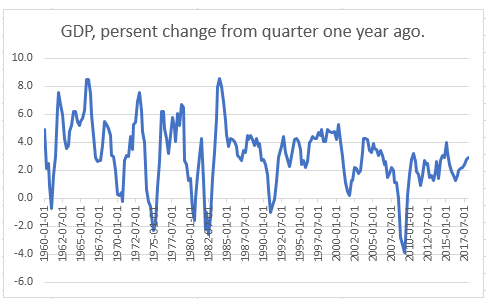
The graphical representation of quarterly growth rates of real GDP from 1960 to last year using the percent change from a year ago.
b)
Explanation of Solution
The data of quarterly growth rates of real GDP from 1960 to last year using the percent change from a year ago is as follows:
| Date | GDP, percentage change from quarter one year ago. |
| 1960-01-01 | 4.9 |
| 1960-04-01 | 2.1 |
| 1960-07-01 | 2.5 |
| 1960-10-01 | 0.9 |
| 1961-01-01 | -0.7 |
| 1961-04-01 | 1.6 |
| 1961-07-01 | 3.0 |
| 1961-10-01 | 6.4 |
| 1962-01-01 | 7.6 |
| 1962-04-01 | 6.7 |
| 1962-07-01 | 6.0 |
| 1962-10-01 | 4.3 |
| 1963-01-01 | 3.6 |
| 1963-04-01 | 3.8 |
| 1963-07-01 | 4.8 |
| 1963-10-01 | 5.2 |
| 1964-01-01 | 6.2 |
| 1964-04-01 | 6.2 |
| 1964-07-01 | 5.5 |
| 1964-10-01 | 5.2 |
| 1965-01-01 | 5.5 |
| 1965-04-01 | 5.7 |
| 1965-07-01 | 6.3 |
| 1965-10-01 | 8.5 |
| 1966-01-01 | 8.5 |
| 1966-04-01 | 7.5 |
| 1966-07-01 | 6.0 |
| 1966-10-01 | 4.5 |
| 1967-01-01 | 2.9 |
| 1967-04-01 | 2.6 |
| 1967-07-01 | 2.7 |
| 1967-10-01 | 2.7 |
| 1968-01-01 | 3.8 |
| 1968-04-01 | 5.5 |
| 1968-07-01 | 5.3 |
| 1968-10-01 | 5.0 |
| 1969-01-01 | 4.5 |
| 1969-04-01 | 3.1 |
| 1969-07-01 | 3.0 |
| 1969-10-01 | 2.0 |
| 1970-01-01 | 0.3 |
| 1970-04-01 | 0.2 |
| 1970-07-01 | 0.4 |
| 1970-10-01 | -0.2 |
| 1971-01-01 | 2.7 |
| 1971-04-01 | 3.1 |
| 1971-07-01 | 3.0 |
| 1971-10-01 | 4.4 |
| 1972-01-01 | 3.5 |
| 1972-04-01 | 5.3 |
| 1972-07-01 | 5.4 |
| 1972-10-01 | 6.9 |
| 1973-01-01 | 7.6 |
| 1973-04-01 | 6.3 |
| 1973-07-01 | 4.8 |
| 1973-10-01 | 4.0 |
| 1974-01-01 | 0.6 |
| 1974-04-01 | -0.2 |
| 1974-07-01 | -0.6 |
| 1974-10-01 | -1.9 |
| 1975-01-01 | -2.3 |
| 1975-04-01 | -1.8 |
| 1975-07-01 | 0.8 |
| 1975-10-01 | 2.6 |
| 1976-01-01 | 6.2 |
| 1976-04-01 | 6.2 |
| 1976-07-01 | 5.0 |
| 1976-10-01 | 4.3 |
| 1977-01-01 | 3.2 |
| 1977-04-01 | 4.5 |
| 1977-07-01 | 5.8 |
| 1977-10-01 | 5.0 |
| 1978-01-01 | 4.1 |
| 1978-04-01 | 6.1 |
| 1978-07-01 | 5.2 |
| 1978-10-01 | 6.7 |
| 1979-01-01 | 6.5 |
| 1979-04-01 | 2.7 |
| 1979-07-01 | 2.4 |
| 1979-10-01 | 1.3 |
| 1980-01-01 | 1.4 |
| 1980-04-01 | -0.8 |
| 1980-07-01 | -1.6 |
| 1980-10-01 | 0.0 |
| 1981-01-01 | 1.6 |
| 1981-04-01 | 3.0 |
| 1981-07-01 | 4.3 |
| 1981-10-01 | 1.3 |
| 1982-01-01 | -2.2 |
| 1982-04-01 | -1.0 |
| 1982-07-01 | -2.6 |
| 1982-10-01 | -1.4 |
| 1983-01-01 | 1.4 |
| 1983-04-01 | 3.3 |
| 1983-07-01 | 5.7 |
| 1983-10-01 | 7.9 |
| 1984-01-01 | 8.6 |
| 1984-04-01 | 8.0 |
| 1984-07-01 | 6.9 |
| 1984-10-01 | 5.6 |
| 1985-01-01 | 4.6 |
| 1985-04-01 | 3.7 |
| 1985-07-01 | 4.3 |
| 1985-10-01 | 4.2 |
| 1986-01-01 | 4.1 |
| 1986-04-01 | 3.7 |
| 1986-07-01 | 3.1 |
| 1986-10-01 | 2.9 |
| 1987-01-01 | 2.7 |
| 1987-04-01 | 3.4 |
| 1987-07-01 | 3.3 |
| 1987-10-01 | 4.5 |
| 1988-01-01 | 4.2 |
| 1988-04-01 | 4.5 |
| 1988-07-01 | 4.2 |
| 1988-10-01 | 3.8 |
| 1989-01-01 | 4.3 |
| 1989-04-01 | 3.7 |
| 1989-07-01 | 3.9 |
| 1989-10-01 | 2.7 |
| 1990-01-01 | 2.8 |
| 1990-04-01 | 2.4 |
| 1990-07-01 | 1.7 |
| 1990-10-01 | 0.6 |
| 1991-01-01 | -1.0 |
| 1991-04-01 | -0.5 |
| 1991-07-01 | -0.1 |
| 1991-10-01 | 1.2 |
| 1992-01-01 | 2.9 |
| 1992-04-01 | 3.2 |
| 1992-07-01 | 3.7 |
| 1992-10-01 | 4.4 |
| 1993-01-01 | 3.3 |
| 1993-04-01 | 2.8 |
| 1993-07-01 | 2.3 |
| 1993-10-01 | 2.6 |
| 1994-01-01 | 3.4 |
| 1994-04-01 | 4.2 |
| 1994-07-01 | 4.3 |
| 1994-10-01 | 4.1 |
| 1995-01-01 | 3.5 |
| 1995-04-01 | 2.4 |
| 1995-07-01 | 2.7 |
| 1995-10-01 | 2.2 |
| 1996-01-01 | 2.6 |
| 1996-04-01 | 4.0 |
| 1996-07-01 | 4.1 |
| 1996-10-01 | 4.4 |
| 1997-01-01 | 4.3 |
| 1997-04-01 | 4.3 |
| 1997-07-01 | 4.7 |
| 1997-10-01 | 4.5 |
| 1998-01-01 | 4.9 |
| 1998-04-01 | 4.1 |
| 1998-07-01 | 4.1 |
| 1998-10-01 | 4.9 |
| 1999-01-01 | 4.8 |
| 1999-04-01 | 4.7 |
| 1999-07-01 | 4.7 |
| 1999-10-01 | 4.8 |
| 2000-01-01 | 4.2 |
| 2000-04-01 | 5.3 |
| 2000-07-01 | 4.1 |
| 2000-10-01 | 3.0 |
| 2001-01-01 | 2.3 |
| 2001-04-01 | 1.1 |
| 2001-07-01 | 0.5 |
| 2001-10-01 | 0.2 |
| 2002-01-01 | 1.3 |
| 2002-04-01 | 1.3 |
| 2002-07-01 | 2.2 |
| 2002-10-01 | 2.1 |
| 2003-01-01 | 1.8 |
| 2003-04-01 | 2.0 |
| 2003-07-01 | 3.3 |
| 2003-10-01 | 4.3 |
| 2004-01-01 | 4.3 |
| 2004-04-01 | 4.2 |
| 2004-07-01 | 3.4 |
| 2004-10-01 | 3.3 |
| 2005-01-01 | 3.9 |
| 2005-04-01 | 3.6 |
| 2005-07-01 | 3.5 |
| 2005-10-01 | 3.1 |
| 2006-01-01 | 3.4 |
| 2006-04-01 | 3.1 |
| 2006-07-01 | 2.4 |
| 2006-10-01 | 2.6 |
| 2007-01-01 | 1.5 |
| 2007-04-01 | 1.8 |
| 2007-07-01 | 2.2 |
| 2007-10-01 | 2.0 |
| 2008-01-01 | 1.1 |
| 2008-04-01 | 1.1 |
| 2008-07-01 | 0.0 |
| 2008-10-01 | -2.8 |
| 2009-01-01 | -3.3 |
| 2009-04-01 | -3.9 |
| 2009-07-01 | -3.0 |
| 2009-10-01 | 0.2 |
| 2010-01-01 | 1.7 |
| 2010-04-01 | 2.8 |
| 2010-07-01 | 3.2 |
| 2010-10-01 | 2.6 |
| 2011-01-01 | 1.9 |
| 2011-04-01 | 1.7 |
| 2011-07-01 | 0.9 |
| 2011-10-01 | 1.6 |
| 2012-01-01 | 2.7 |
| 2012-04-01 | 2.4 |
| 2012-07-01 | 2.5 |
| 2012-10-01 | 1.5 |
| 2013-01-01 | 1.6 |
| 2013-04-01 | 1.3 |
| 2013-07-01 | 1.9 |
| 2013-10-01 | 2.6 |
| 2014-01-01 | 1.4 |
| 2014-04-01 | 2.7 |
| 2014-07-01 | 3.1 |
| 2014-10-01 | 2.9 |
| 2015-01-01 | 4.0 |
| 2015-04-01 | 3.3 |
| 2015-07-01 | 2.4 |
| 2015-10-01 | 1.9 |
| 2016-01-01 | 1.6 |
| 2016-04-01 | 1.3 |
| 2016-07-01 | 1.6 |
| 2016-10-01 | 2.0 |
| 2017-01-01 | 2.1 |
| 2017-04-01 | 2.2 |
| 2017-07-01 | 2.4 |
| 2017-10-01 | 2.8 |
| 2018-01-01 | 2.9 |
c)
The graphical representation of quarterly growth rates of real GDP from 1960 to last year using the percent change from preceding period quarterly. To ascertain the least volatile and most volatile measure, and the differences between these three series.
c)
Explanation of Solution
The data of quarterly growth rates of real GDP from 1960 to last year using the percent change from preceding period quarterly is as follows:
| Date | GDP percent change from preceding period, quarterly |
| 1960-04-01 | -2.1 |
| 1960-07-01 | 2.0 |
| 1960-10-01 | -5.0 |
| 1961-01-01 | 2.7 |
| 1961-04-01 | 7.0 |
| 1961-07-01 | 7.9 |
| 1961-10-01 | 8.1 |
| 1962-01-01 | 7.3 |
| 1962-04-01 | 3.7 |
| 1962-07-01 | 5.0 |
| 1962-10-01 | 1.3 |
| 1963-01-01 | 4.4 |
| 1963-04-01 | 4.6 |
| 1963-07-01 | 9.1 |
| 1963-10-01 | 2.6 |
| 1964-01-01 | 8.7 |
| 1964-04-01 | 4.4 |
| 1964-07-01 | 6.4 |
| 1964-10-01 | 1.2 |
| 1965-01-01 | 10.0 |
| 1965-04-01 | 5.1 |
| 1965-07-01 | 9.2 |
| 1965-10-01 | 9.5 |
| 1966-01-01 | 10.1 |
| 1966-04-01 | 1.4 |
| 1966-07-01 | 3.4 |
| 1966-10-01 | 3.3 |
| 1967-01-01 | 3.6 |
| 1967-04-01 | 0.2 |
| 1967-07-01 | 3.8 |
| 1967-10-01 | 3.0 |
| 1968-01-01 | 8.4 |
| 1968-04-01 | 6.9 |
| 1968-07-01 | 3.1 |
| 1968-10-01 | 1.6 |
| 1969-01-01 | 6.4 |
| 1969-04-01 | 1.2 |
| 1969-07-01 | 2.7 |
| 1969-10-01 | -1.9 |
| 1970-01-01 | -0.6 |
| 1970-04-01 | 0.6 |
| 1970-07-01 | 3.7 |
| 1970-10-01 | -4.2 |
| 1971-01-01 | 11.3 |
| 1971-04-01 | 2.2 |
| 1971-07-01 | 3.3 |
| 1971-10-01 | 0.9 |
| 1972-01-01 | 7.6 |
| 1972-04-01 | 9.4 |
| 1972-07-01 | 3.8 |
| 1972-10-01 | 6.9 |
| 1973-01-01 | 10.3 |
| 1973-04-01 | 4.4 |
| 1973-07-01 | -2.1 |
| 1973-10-01 | 3.8 |
| 1974-01-01 | -3.4 |
| 1974-04-01 | 1.0 |
| 1974-07-01 | -3.7 |
| 1974-10-01 | -1.5 |
| 1975-01-01 | -4.8 |
| 1975-04-01 | 2.9 |
| 1975-07-01 | 7.0 |
| 1975-10-01 | 5.5 |
| 1976-01-01 | 9.3 |
| 1976-04-01 | 3.0 |
| 1976-07-01 | 2.2 |
| 1976-10-01 | 2.9 |
| 1977-01-01 | 4.8 |
| 1977-04-01 | 8.0 |
| 1977-07-01 | 7.4 |
| 1977-10-01 | 0.0 |
| 1978-01-01 | 1.3 |
| 1978-04-01 | 16.4 |
| 1978-07-01 | 4.1 |
| 1978-10-01 | 5.5 |
| 1979-01-01 | 0.7 |
| 1979-04-01 | 0.4 |
| 1979-07-01 | 3.0 |
| 1979-10-01 | 1.0 |
| 1980-01-01 | 1.3 |
| 1980-04-01 | -8.0 |
| 1980-07-01 | -0.5 |
| 1980-10-01 | 7.7 |
| 1981-01-01 | 8.1 |
| 1981-04-01 | -2.9 |
| 1981-07-01 | 4.9 |
| 1981-10-01 | -4.3 |
| 1982-01-01 | -6.1 |
| 1982-04-01 | 1.8 |
| 1982-07-01 | -1.5 |
| 1982-10-01 | 0.2 |
| 1983-01-01 | 5.4 |
| 1983-04-01 | 9.4 |
| 1983-07-01 | 8.2 |
| 1983-10-01 | 8.6 |
| 1984-01-01 | 8.1 |
| 1984-04-01 | 7.1 |
| 1984-07-01 | 3.9 |
| 1984-10-01 | 3.3 |
| 1985-01-01 | 3.9 |
| 1985-04-01 | 3.6 |
| 1985-07-01 | 6.2 |
| 1985-10-01 | 3.0 |
| 1986-01-01 | 3.8 |
| 1986-04-01 | 1.8 |
| 1986-07-01 | 3.9 |
| 1986-10-01 | 2.2 |
| 1987-01-01 | 3.0 |
| 1987-04-01 | 4.4 |
| 1987-07-01 | 3.5 |
| 1987-10-01 | 7.0 |
| 1988-01-01 | 2.1 |
| 1988-04-01 | 5.4 |
| 1988-07-01 | 2.4 |
| 1988-10-01 | 5.4 |
| 1989-01-01 | 4.1 |
| 1989-04-01 | 3.1 |
| 1989-07-01 | 3.0 |
| 1989-10-01 | 0.8 |
| 1990-01-01 | 4.4 |
| 1990-04-01 | 1.5 |
| 1990-07-01 | 0.3 |
| 1990-10-01 | -3.6 |
| 1991-01-01 | -1.9 |
| 1991-04-01 | 3.2 |
| 1991-07-01 | 2.0 |
| 1991-10-01 | 1.4 |
| 1992-01-01 | 4.9 |
| 1992-04-01 | 4.4 |
| 1992-07-01 | 4.0 |
| 1992-10-01 | 4.2 |
| 1993-01-01 | 0.7 |
| 1993-04-01 | 2.3 |
| 1993-07-01 | 1.9 |
| 1993-10-01 | 5.6 |
| 1994-01-01 | 3.9 |
| 1994-04-01 | 5.5 |
| 1994-07-01 | 2.4 |
| 1994-10-01 | 4.7 |
| 1995-01-01 | 1.4 |
| 1995-04-01 | 1.2 |
| 1995-07-01 | 3.5 |
| 1995-10-01 | 2.7 |
| 1996-01-01 | 3.0 |
| 1996-04-01 | 6.8 |
| 1996-07-01 | 3.6 |
| 1996-10-01 | 4.2 |
| 1997-01-01 | 2.6 |
| 1997-04-01 | 6.8 |
| 1997-07-01 | 5.1 |
| 1997-10-01 | 3.5 |
| 1998-01-01 | 4.1 |
| 1998-04-01 | 3.8 |
| 1998-07-01 | 5.1 |
| 1998-10-01 | 6.6 |
| 1999-01-01 | 3.8 |
| 1999-04-01 | 3.1 |
| 1999-07-01 | 5.3 |
| 1999-10-01 | 7.0 |
| 2000-01-01 | 1.5 |
| 2000-04-01 | 7.5 |
| 2000-07-01 | 0.5 |
| 2000-10-01 | 2.5 |
| 2001-01-01 | -1.1 |
| 2001-04-01 | 2.4 |
| 2001-07-01 | -1.7 |
| 2001-10-01 | 1.1 |
| 2002-01-01 | 3.5 |
| 2002-04-01 | 2.4 |
| 2002-07-01 | 1.8 |
| 2002-10-01 | 0.6 |
| 2003-01-01 | 2.2 |
| 2003-04-01 | 3.5 |
| 2003-07-01 | 7.0 |
| 2003-10-01 | 4.7 |
| 2004-01-01 | 2.2 |
| 2004-04-01 | 3.1 |
| 2004-07-01 | 3.8 |
| 2004-10-01 | 4.1 |
| 2005-01-01 | 4.5 |
| 2005-04-01 | 1.9 |
| 2005-07-01 | 3.6 |
| 2005-10-01 | 2.6 |
| 2006-01-01 | 5.4 |
| 2006-04-01 | 0.9 |
| 2006-07-01 | 0.6 |
| 2006-10-01 | 3.5 |
| 2007-01-01 | 0.9 |
| 2007-04-01 | 2.3 |
| 2007-07-01 | 2.2 |
| 2007-10-01 | 2.5 |
| 2008-01-01 | -2.3 |
| 2008-04-01 | 2.1 |
| 2008-07-01 | -2.1 |
| 2008-10-01 | -8.4 |
| 2009-01-01 | -4.4 |
| 2009-04-01 | -0.6 |
| 2009-07-01 | 1.5 |
| 2009-10-01 | 4.5 |
| 2010-01-01 | 1.5 |
| 2010-04-01 | 3.7 |
| 2010-07-01 | 3.0 |
| 2010-10-01 | 2.0 |
| 2011-01-01 | -1.0 |
| 2011-04-01 | 2.9 |
| 2011-07-01 | -0.1 |
| 2011-10-01 | 4.7 |
| 2012-01-01 | 3.2 |
| 2012-04-01 | 1.7 |
| 2012-07-01 | 0.5 |
| 2012-10-01 | 0.5 |
| 2013-01-01 | 3.6 |
| 2013-04-01 | 0.5 |
| 2013-07-01 | 3.2 |
| 2013-10-01 | 3.2 |
| 2014-01-01 | -1.1 |
| 2014-04-01 | 5.5 |
| 2014-07-01 | 5.0 |
| 2014-10-01 | 2.3 |
| 2015-01-01 | 3.2 |
| 2015-04-01 | 3.0 |
| 2015-07-01 | 1.3 |
| 2015-10-01 | 0.1 |
| 2016-01-01 | 2.0 |
| 2016-04-01 | 1.9 |
| 2016-07-01 | 2.2 |
| 2016-10-01 | 2.0 |
| 2017-01-01 | 2.3 |
| 2017-04-01 | 2.2 |
| 2017-07-01 | 3.2 |
| 2017-10-01 | 3.5 |
| 2018-01-01 | 2.5 |
| 2018-04-01 | 3.5 |
The graphical representation of the quarterly growth rates of real GDP from 1960 to 2018 using the percent change from the previous quarter is as follows:
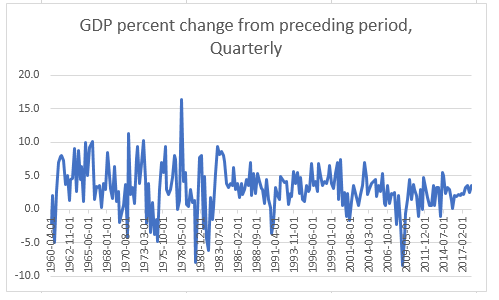
The quarterly percent change at the annual rate indicates the percent change, if the quarterly rate goes on for four quarters. It is calculated by compounding of quarterly rate for four quarters.
For some unpredictable quarterly series, percentage changes at quarterly rates rather than at annual rates are preferred because the question of comparability is less relevant and because the annual rate of change is smaller.
When these three data and their respective graph compare to each other for some specific successive period of time, following result is determined:
- 2nd one that is, GDP growth rate using percentage change from quarter one year ago is most volatile and 3rd way that is, GDP growth rate by using percent change from preceding period quarterly is least volatile.
Want to see more full solutions like this?
Chapter 2 Solutions
Macroeconomics

- Suppose that the annual rates of growth of real GDP in Econoland over a five-year period were as follows: Year Growth Rate (X) 1 2 1 3 -2 4 4 a. What was the average of these growth rates in Econoland over these five years? Instructions: Enter your answer rounded to 1 decimal place. percent b. What term would economists use to describe what happened in year 3? Recession c. If the growth rate in year 3 had been a positive 2 percent rather than a negative 2 percent, what would have been Econoland's average growth rate over the five years? Instructions: Enter your answer as a whole number. percentarrow_forwardYou are going to compare and contrast the GDP of the United States to that of another country of your choice for the last 3 years. Your report in narrative format should address the following questions: Describe the current GDP growth rate of the two countries. Which component of the GDP of the two countries changed the most for the last 3 years? Identify the possible causes of the changes. Describe the biggest component of the GDP of the two countries. What recommendations would you make in order to boost the GDP of the two countries?arrow_forwardThe following table shows data on a hypothetical country's real GDP from 1970 through 1978: Year Real GDP (Billions of Dollars ) 1970 368 1971 380 1972 384 1973 392 1974 408 1975 The green line on the following graph shows the economy's long-term growth trend. Use the blue points (circle symbol) to plot the real GDP in each of the years listed. (Note: Plot your points in the order in which you would like them connected. Line segments will connect the points automatically.) Next, place the black point (plus symbol) on the graph to indicate the point on the real GDP curve that definitely represents a peak. Finally, place the grey point (star symbol) on the graph to indicate the point on the real GDP curve that definitely represents a trough. Real GDP Peak Trough 1970 1971 1972 1973 1974 1975 1976 1977 1978 440 4 REAL GDP (Billions of dollars) YEAR Growth trend Calculate the percentage change in real GDP in each of the years shown. (Hint: The percentage change in real GDP equals the…arrow_forward
- You choose Italy as a country ,gather information and accumulate Data of its GDP for the past 10 years. Analyze the trends of GDP in the last 10 years Analyze the contribution of different Business Sectors to GDP Analyze the growing Business Sectors in Economy - analyze their contribution to GDP and analyze their contribution to other Macro Economic Performance Indicators of the country. Support your argument with reasons Analyze the Sectors (if any) which are showing negative growth in the last (0 -10) years. Give reasons Analyze and give suggestions to the government that which Business sectors should be supported by the government for Economic Growth of the economy. give this and in 3000 words along with tables charts and graphs.arrow_forwardPart C: Following graph shows business cycle fluctuation in a hypothetical economy. "Y" denotes year, and "Q" denotes quarter. What do points A, B, C, and D denote? Write at least a sentence each about what these points denote. Also, explain what represent the curve segments: A to B, B to C, and C to D. Lastly, because economic activity fluctuates, how is long-term growth possible? Real GDP (billion $) 50 45 40 B 35 30 25 20 15 10 5 Y1Q1 Y1Q2 Y1Q3 Y1Q4 Y2 Q1 Y2 Q2 Y2 Q4 Y3 Q1 Y3Q2 un oarrow_forwardYear Real GDP Nominal GDP 2019 $15,510.79 $17,310.70 2020 $17,495.23 $18,761.83 2021 $18,209.59 $19,253.97 Refer to the table above. What is the growth rate in real GDP from 2020 to 2021? Answer this as a percentage and round your answer to two digits after the decimal without the percentage sign. ex. If you found the rate to be 5.125%, answer 5.13.arrow_forward
- ANNUAL CHANGE IN REAL GDP (Percent) , دن A -5 1981 1982 Peak Recovery 1983 Expansion 1984 Trough 1985 YEAR This economy experienced a contraction in the year period in which the level of Real GDP contraction is seen as a period in which the growth rate of Real GDP 1986 1987 1988 In 1988, which of the following phases in the business cycle could this economy have been experiencing? Check all that apply. Annual Change . On the first graph (showing Real GDP), this contraction is seen as a On the second graph (showing annual change in Real GDP), thisarrow_forwardThe price and quantity data for Year 1 and Year 2 are as follows: Bread 50 1 Butter 100 Year 1 Quantity Year 1 Price Year 2 Quantity Year 2 Price 80 120 1.60 1.25 What is the ratio of real GDP in year 2 to real GDP in year 1, using year 1 as the base year? Answer Choices: 1.254 b. 1.354 1.434 d. 1.534 a. C. Acivate Windcysarrow_forwardSay, in coming February, 2022 the Central Statistical Qrganisation comes out with its Income estimates, and according to the released numbers the growth in GDP over the year 2021 – 22 has been 8%. a) What are the possible practical problems in interpreting the 8% growth figure released in February? b) Under what circumstances can one say that the real incomes have gone up by 8%? c) Can one say that the standards of living in the last year have improved by 8%? Under what condition one can say that?arrow_forward
- i need help with the last 6 problems left blank - If 2012 is the base year, real GDP in 2011 was $enter your response here and real GDP in 2012 was $enter your response here . (Enter your responses as integers.) Based on your answer above, the percentage change in real GDP between 2011 and 2012 was enter your response here percent. (Round your response to two decimal places and use a minus sign if necessary.) Using 2011 as the base year, the GDP deflator in 2011 was enter your response here and the GDP deflator in 2012 was enter your response here . (Round your responses to one decimal place.) Based on your answer above, the percentage change in prices between 2011 and 2012 was enter your response here percent. (Round your responses to one decimal place and use a minus sign if necessary.)arrow_forwardWhen analyzing key macroeconomics to assess GDP growth/decline, how would you measure the performance relative to sequential and year-to-year data?arrow_forwardc) The production and prices of T-Shirts and Jeans in Fashion Land in 2020 and 2021 are as follows: Quantity of T- Quantity of Price of T- Price of Shirts Jeans Shirts Jeans (thousands) (thousands) 2020 10 $25 10 $60 2021 15 $30 12 $70 Taking 2020 as the base year, calculate the: i) Nominal GDP in 2021 ii) Real GDP in 2020 and 2021 i) Real GDP Growth Rate in 2021 iv) Nominal GDP per Capita in 2021 if the population is 550.arrow_forward
 Managerial Economics: A Problem Solving ApproachEconomicsISBN:9781337106665Author:Luke M. Froeb, Brian T. McCann, Michael R. Ward, Mike ShorPublisher:Cengage Learning
 Macroeconomics: Private and Public Choice (MindTa...EconomicsISBN:9781305506756Author:James D. Gwartney, Richard L. Stroup, Russell S. Sobel, David A. MacphersonPublisher:Cengage Learning
 Economics: Private and Public Choice (MindTap Cou...EconomicsISBN:9781305506725Author:James D. Gwartney, Richard L. Stroup, Russell S. Sobel, David A. MacphersonPublisher:Cengage Learning