Concept explainers
Deriving production–possibility frontier (
Explanation of Solution
Production–possibility frontier is the combination of different combinations of two goods that a country can produce, while all the resources are utilized. Assume that a country is producing two goods say X and Y. Then, the given Table (1) shows different combinations of goods that a country can produce with fully utilized resources as shown below:
Table 1
| Combination | Good X | Good Y |
| A | 10 | 0 |
| B | 5 | 5 |
| C | 0 | 10 |
Use the given table to depict the production–possibility frontier as shown below:
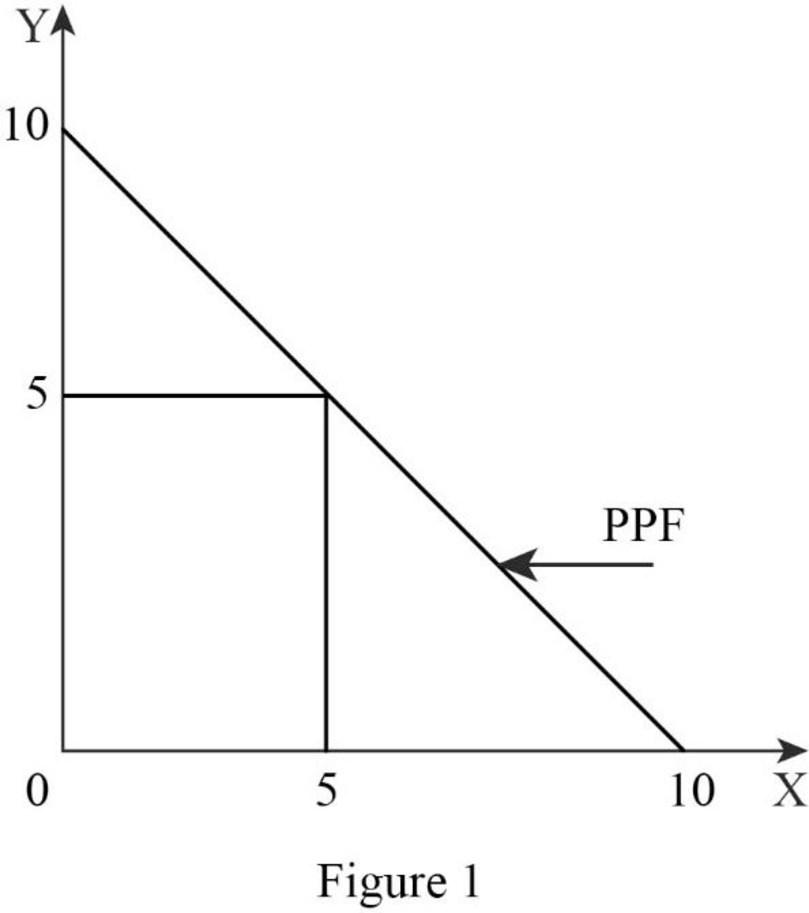
In Figure 1, the horizontal axis represents good X and the vertical axis represents good Y. In the first combination, the country can produce 10 units of good X and 0 unit of good Y. In the second combination, the country can produce 5 units of both the goods. In the third combination, the country can produce 0 unit of good X and 10 units of good Y. The country can produce any of the given combinations of goods. These combinations of goods form production–possibility frontier.
Production–possibility frontier (PPF): Production–possibility frontier or PPF curve shows the combination of the two commodities that the country produced efficiently using the given technology.
Want to see more full solutions like this?
Chapter 2 Solutions
Microeconomics (Book Only)


- How can the Big Mac Index be used to make PPP comparisons between countries?arrow_forwardBriefly describe the term" developed countries"arrow_forwardWhat are some additional strengths and weaknesses of the Human Development Index as a comparative measure of human welfare? If you were designing the HDI, what might you do differently, and why?arrow_forward
- Why is an open economy better than a closed one?arrow_forwardGDP IS EQUAL A C+I+ G + NX B Y-G C C+I+G - NX D Y+I The PPF curve might be Bow shaped L shaed Dimiishing shaped U shapedarrow_forwardWhy would you expect an inverse relationship between self-sufficiency and real GDP per capita?arrow_forward
- How will you differentiate an open economy from a closed economy? Explain with the help of an example.arrow_forwardHow has the proliferation of internet, online, and computer technologies impacted underdeveloped countries? How do those compare to the impacts on developed countries? Please and Thank youarrow_forwardQuestion 37 In the flow diagram representing an open economy, which of the following is TRUE? GNE plus imports are equal to GDP. GNE plus the trade balance (TB) are equal to GDP (total domestic production). GDP rises as GNI rises. GNE are always less than GDP.arrow_forward


