
Managerial Accounting
15th Edition
ISBN: 9781337912020
Author: Carl Warren, Ph.d. Cma William B. Tayler
Publisher: South-Western College Pub
expand_more
expand_more
format_list_bulleted
Videos
Textbook Question
Chapter 16, Problem 3MAD
Deere & Company (DE) manufactures and distributes farm and construction machinery that it sells around the world. In addition to its manufacturing operations, Deere’s credit division loans money to customers to finance the purchase of their farm and construction equipment.
The following information is available for three recent years (in millions except per-share amounts):
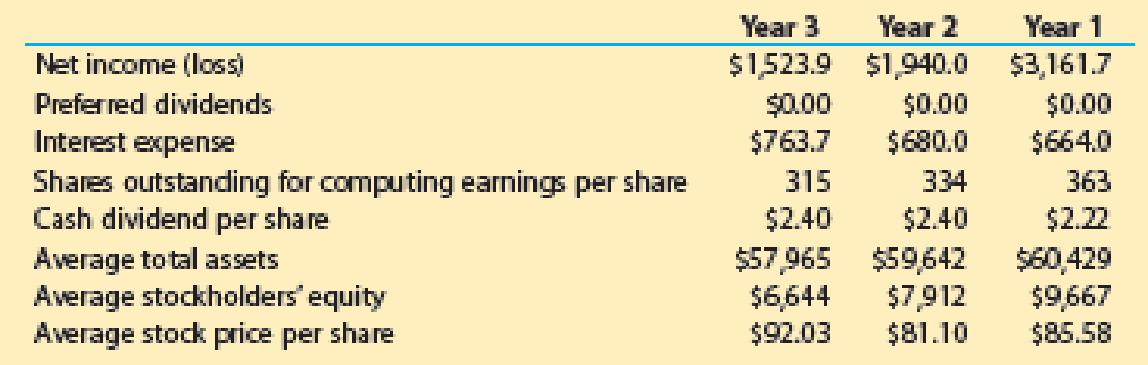
- 1. Calculate the following ratios for each year. Round ratios and percentages to one decimal place, except for per-share amounts, which should be rounded to the nearest cent.
- a. Return on total assets
- b. Return on
stockholders' equity - c. Earnings per share
- d. Dividend yield
- e. Price-earnings ratio
- 2. Based on these data, evaluate Deere’s profitability.
Expert Solution & Answer
Want to see the full answer?
Check out a sample textbook solution
Students have asked these similar questions
Deere & Company manufactures and distributes farm and construction machinery that it sells around the world. In addition to its manufacturing operations, Deere’s credit division loans money to customers to finance the purchase of their farm and construction equipment.The following information is available for three recent years (in millions except pershare amounts):
Please see the attachment for details:
1. Calculate the following ratios for each year, rounding ratios and percentages to one decimal place, except for per-share amounts:a. Return on total assetsb. Return on stockholders’ equityc. Earnings per shared. Dividend yielde. Price-earnings ratio2. Based on these data, evaluate Deere’s profitability.
The following financial data (in thousands) were taken from recent financial statements of Staples, Inc.:
Please see the attachment for details:
1. Determine the times interest earned ratio for Staples in Year 3, Year 2, and Year 1? Round your answers to one decimal place.2. Evaluate this ratio for Staples.
The Clorox Company (CLX) and The Procter & Gamble Company (PG) produce and sell packaged consumer products around the world. Income and interest expense information from financial statements for a recent year follows (in millions):
Clorox
Procter & Gamble
Interest expense
$88
$579
Income before income tax expense
983
13,369
a. Compute the time's interest earned for each company. Round to one decimal place.
Clorox:
Procter & Gamble:
Chapter 16 Solutions
Managerial Accounting
Ch. 16 - Prob. 1DQCh. 16 - What is the advantage of using comparative...Ch. 16 - Prob. 3DQCh. 16 - Prob. 4DQCh. 16 - Prob. 5DQCh. 16 - What do the following data, taken from a...Ch. 16 - Prob. 7DQCh. 16 - Prob. 8DQCh. 16 - The dividend yield of Suburban Propane Partners,...Ch. 16 - Prob. 10DQ
Ch. 16 - Prob. 1BECh. 16 - Prob. 2BECh. 16 - The following items are reported on a companys...Ch. 16 - Prob. 4BECh. 16 - Prob. 5BECh. 16 - Prob. 6BECh. 16 - Prob. 7BECh. 16 - Prob. 8BECh. 16 - Prob. 9BECh. 16 - Prob. 10BECh. 16 - Prob. 11BECh. 16 - Prob. 1ECh. 16 - The following comparative income statement (in...Ch. 16 - Prob. 3ECh. 16 - Prob. 4ECh. 16 - Prob. 5ECh. 16 - The following data were taken from the balance...Ch. 16 - PepsiCo, Inc. (PEP), the parent company of...Ch. 16 - Current position analysis The bond indenture for...Ch. 16 - Prob. 9ECh. 16 - Accounts receivable analysis Xavier Stores Company...Ch. 16 - Prob. 11ECh. 16 - Prob. 12ECh. 16 - Ratio of liabilities to stockholders equity and...Ch. 16 - Hasbro, Inc. (HAS), and Mattel, Inc. (MAT), are...Ch. 16 - Recent balance sheet information for two companies...Ch. 16 - Prob. 16ECh. 16 - Prob. 17ECh. 16 - Prob. 18ECh. 16 - Prob. 19ECh. 16 - Prob. 20ECh. 16 - Prob. 21ECh. 16 - Prob. 22ECh. 16 - Prob. 23ECh. 16 - Prob. 24ECh. 16 - Prob. 25ECh. 16 - Comprehensive income Anson Industries, Inc.,...Ch. 16 - Prob. 1PACh. 16 - Prob. 2PACh. 16 - Prob. 3PACh. 16 - Measures of liquidity, solvency, and profitability...Ch. 16 - Prob. 5PACh. 16 - Prob. 1PBCh. 16 - Prob. 2PBCh. 16 - Prob. 3PBCh. 16 - Prob. 4PBCh. 16 - Prob. 5PBCh. 16 - Prob. 1MADCh. 16 - Prob. 2MADCh. 16 - Deere Company (DE) manufactures and distributes...Ch. 16 - Marriott International, Inc. (MAR), and Hyatt...Ch. 16 - Prob. 1TIFCh. 16 - Real-world annual report The financial statements...Ch. 16 - Prob. 3TIF
Knowledge Booster


Learn more about
Need a deep-dive on the concept behind this application? Look no further. Learn more about this topic, accounting and related others by exploring similar questions and additional content below.Similar questions
- Grammatico Company has just completed its third year of operations. The income statement is as follows: Selected information from the balance sheet is as follows: Required: Note: Round answers to two decimal places. 1. Compute the times-interest-earned ratio. 2. Compute the debt ratio. 3. CONCEPTUAL CONNECTION Assume that the lower quartile, median, and upper quartile values for debt and times-interest-earned ratios in Grammaticos industry are as follows: How does Grammatico compare with the industrial norms? Does it have too much debt?arrow_forwardRotorua Products, Ltd., of New Zealand markets agricultural products for the burgeoning Asian consumer market. The company's current assets, current liabilities, and sales have been reported as follows over the last five years (Year 5 is the most recent year): Year 1 Year 2 Year 3 Year 4 Year 5 Sales $4,546,750 $4,760,520 $5,009,460 $5,429,040 $5,695,160 $ $ 2$ 2$ 87,970 513,073 895,198 $ 73,368 572,803 907,666 Cash 90,291 401,499 815,059 95,951 417,195 869,228 92,001 448,219 832,208 Accounts receivable, net Inventory Total current assets $1,306,849 $1,382,374 $1,372,428 $1,496,241 $1,553,837 Current liabilities $ 318,258 $ 335,298 $ 335,856 $ 325,402 $ 399,778 Required: 1. Express all of the asset, liability, and sales data in trend percentages. Use Year 1 as the base year. (Round your percentage answers to 1 decimal place (i.e., 0.1234 should be entered as 12.3).) Year 1 Year 2 Year 3 Year 4 Year 5 Sales % % % % % Current assets: Cash Accounts receivable Inventory Total current…arrow_forwardRotorua Products, Ltd., of New Zealand markets agricultural products for the burgeoning Asian consumer market. The company’s current assets, current liabilities, and sales have been reported as follows over the last five years (Year 5 is the most recent year): image $NZ stands for New Zealand dollars. Required: Express all of the asset, liability, and sales data in trend percentages. (Show percentages for each item.) Use Year I as the base year and carry computations to one decimal place. Comment on the results of your analysis.arrow_forward
- Rotorua Products, Limited, of New Zealand markets agricultural products for the burgeoning Asian consumer market. The company’s current assets, current liabilities, and sales over the last five years (Year 5 is the most recent year) are as follows: Year 1 Year 2 Year 3 Year 4 Year 5 Sales $ 4,629,850 $ 4,882,820 $ 5,051,360 $ 5,561,430 $ 5,779,850 Cash $ 92,281 $ 100,754 $ 100,089 $ 88,760 $ 74,387 Accounts receivable, net 400,699 434,827 445,236 507,424 568,470 Inventory 805,036 874,663 822,264 897,114 903,388 Total current assets $ 1,298,016 $ 1,410,244 $ 1,367,589 $ 1,493,298 $ 1,546,245 Current liabilities $ 317,424 $ 340,337 $ 332,468 $ 321,672 $ 391,861 Required: 1. Express all of the asset, liability, and sales data in trend percentages. Use Year 1 as the base year. (Round your percentage answers to 1 decimal place (i.e., 0.1234 should be entered as 12.3).)arrow_forwardAnalyze Deere & Company Deere & Company (DE) manufactures and distributes farm and construction machinery that it sells around the world. In addition to its manufacturing operations, Deere's credit division loans money to customers to finance the purchase of their farm and construction equipment. The following information is available for three recent years (in millions except per-share amounts): Year 3 Year 2 Year 1 Net income (loss) $1,523.9 $1,940.0 $3,161.7 Preferred dividends $ 0.00 $ 763.7 $ 680.0 $ 664.0 $ 0.00 $0.00 Interest expense Shares outstanding for computing earnings per share 315 334 363 Cash dividend per share $ 2.40 $ 2.40 $ 2.22 $ 57,965 $ 59,642 $ 60,429 $ 6,644 $ 7,912 $ 9,667 $ 92.03 $ 81.10 $ 85.58 Average total assets Average stockholders' equity Average stock price per share 1. Calculate the following ratios for each year (Round ratios and percentages to one decimal place, except for per-share amounts. Round per-share amounts to two decimal places.): Year 3…arrow_forwardRotorua Products, Limited, of New Zealand markets agricultural products for the burgeoning Asian consumer market. The company's current assets, current liabilities, and sales over the last five years (Year 5 is the most recent year) are as follows: Sales Cash Accounts receivable, net Inventory Total current assets Current liabilities Sales Current assets: Cash Accounts receivable, net Inventory Total current assets Current liabilities Year 1 Year 2 $ 4,654,890 $ 98,625 412,539 812,564 $ 4,785,720 $ 91,603 423,536 876,894 $ 1,323,728 $ 1,392,033 $ 339,515 $ 300,175 Required: 1. Express all of the asset, liability, and sales data in trend percentages. Use Year 1 as the base year. (Round your percentage answers to 1 decimal place (i.e., 0.1234 should be entered as 12.3).) Year 1 % % % % % % Year 2 % % % % % % Year 3. Year 4 Year 5. $ 5,597,560 $ 5,808,960 $ 4,989,130 $ 103,392 439,311 817,070 $ 1,359,773 $ 1,467,996 $ 1,554,121 $333,288 $ 328,594 $ 409,089 $ 74,976 501,957 891,063 $…arrow_forward
- Ecru Company has identified five industry segments: plastics, metals, lumber, paper, and finance. It appropriately consolidated each of these segments in producing its annual financial statements. Information describing each segment (in thousands) follows: Sales to outside parties Intersegment transfers Interest income from outside parties Interest income from intersegment loans Operating expenses Interest expense Tangible assets Intangible assets Intersegment loans (debt.) Plastics $6,870 a. Revenue test: 163 0 0 4,354 83 1,567 94 Metals $2,419 186 41 0 1,832 38 3,261 416 0 Lumber $ 746 151 28 0 1,136 73 589 0 0 Ecru does not allocate its $1,360,000 in common expenses to the various segments. " Perform testing procedures to determine Ecru's reportable operating segments. Paper Finance $ 457 $0 163 0 0 689 20 836 70 0 0 49 214 38 109 214 0 719arrow_forwardRotorua Products, Limited, of New Zealand markets agricultural products for the burgeoning Asian consumer market. The company's current assets, current liabilities, and sales over the last five years (Year 5 is the most recent year) are as follows: Sales Cash Accounts receivable, net Inventory Total current assets Current liabilities Sales Current assets: Cash Accounts receivable, net Inventory Total current assets Current liabilities Year 1 $4,593,830 $ 87,529 404,278 801,291 $ 1,293,098 $ 304,544 Year 1 Year 2 $4,780,780 $93,256 426,549 868,050 $ 1,387,855 $ 338,428 % % % % % % % % % % Year 3 $4,986,700 Required: 1. Express all of the asset, liability, and sales data in trend percentages. Use Year 1 as the base year. (Round your percentage answers to 1 decimal place (i.e., 0.1234 should be entered as 12.3).) ered as 12 Year 2 Year 3 $ 86,310 433,877 819,354 $ 1,339,541 $ 334,294 % % % % Year 4 $ 5,563,020 Year 4 $ 77,754 496,981 899,709 $1,474,444 $ 322,187 % % % % Year 5 $ 5,640,450…arrow_forwardRotorua Products sells agricultural products in the burgeoning Asian market. The company's current assets, current liabilities, and sales over the last five years (Year 5 is the most recent year) are as follows: Sales Cash Accounts receivable, net Inventory Total current assets Current liabilities Sales Current assets: Cash Accounts receivable, net Inventory Total current assets Current liabilities Year 11 Year 2 Year 3 Year 4 Year 5 $4,545,400 $4,737,850 $ 5,126,380 $5,421,900 $5,776,190 Year 1 $ 88,854 418,283 800,380 $ 1,307,517 $ 313,578 Required: 1. Express all of the asset, liability, and sales data in trend percentages. Use Year 1 as the base year. Note: Round your percentage answers to 1 decimal place (i.e., 0.1234 should be entered as 12.3). % % % % % % Year 2 $ 88,845 $ 77,057 435,833 587,279 $ 90,380 417,076 876,061 $1,383,517 $ 1,350,248 $ 1,466,414 $1,552,502 $ 346,822 $ 336,685 $ 335,107 $ 390,612 825,570 882,078 % % % % % % Year 3 % % % % Year 4 % % $ 80,928 569,984…arrow_forward
- Ecru Company has identified five industry segments: plastics, metals, lumber, paper, and finance. It appropriately consolidated each of these segments in producing its annual financial statements. Information describing each segment (in thousands) follows: Sales to outside parties Intersegment transfers Interest income from outside parties Interest income from intersegment loans Operating expenses Interest expense Tangible assets Intangible assets Intersegment loans (debt) Plastics $6,855 163 a. Revenue test: b. Profit or loss test: c. Asset test: 0 0 4,334 82 1,577 93 0 Metals $2,414 185 40 0 1,822 37 3,256 415 0 Lumber $ 741 150 27 0 1, 126 72 584 0 0 Ecru does not allocate its $1,400,000 in common expenses to the various segments. Perform testing procedures to determine Ecru's reportable operating segments. Paper Finance $ 452 162 0 0 684 22 831 69 0 0 48 213 37 108 209 0 718arrow_forwardRotorua Products, Ltd., of New Zealand markets agricultural products for the burgeoning Asian consumer market. The company's current assets, current liabilities, and sales over the last five years (Year 5 is the most recent year) are as follows: Year 1 Year 2 Year 3 Year 4 Year 5 Sales $1,800, 000 $1,980,000 $2,070,000 $2,160,000 $2, 250, 000 50,000 300,000 600,000 Cash $4 24 Accounts receivable, net Inventory 65,000 345,000 660,000 48,000 405,000 40,000 510,000 30,000 570,000 750,000 $1,350,000 690,000 720,000 Total current assets $ 950,000 $1,070,000 $1,143,000 $1,270,000 Current liabilities $ 400,000 $ 440,000 $ 520,000 $ 580,000 $ 640,000 Required: 1. Express all of the asset, liability, and sales data in trend percentages. Use Year 1 as the base year. (Round your percentage answers to 1 decimal place (i.e., 0.1234 should be entered as 12.3).) Year 1 Year 2 Year 3 Year 4 Year 5 Sales % % % % % Current assets: % % % % Cash % % % Accounts receivable, net % % % Inventory % % % % %…arrow_forwardAnalyze Deere & Company Deere & Company (DE) manufactures and distributes farm and construction machinery that it sells around the world. In addition to its manufacturing operations, Deere's credit division loans money to customers to finance the purchase of their farm and construction equipment. The following information is available for three recent years (in millions except per-share amounts): Year 3 Year 2 Year 1 Net income (loss) Preferred dividends $1,523.9 $1,940.0 $3,161.7 $ 0.00 $ 763.7 $ 680.0 $ 664.0 $0.00 $ 0.00 Interest expense Shares outstanding for computing earnings per share 315 334 363 Cash dividend per share $ 2.40 $ 2.40 $ 2.22 $ 57,965 $ 59,642 $ 60,429 $ 6,644 $ 7,912 $ 9,667 $ 92.03 $ 81.10 $ 85.58 Average total assets Average stockholders' equity Average stock price per share 1. Calculate the following ratios for each year (Round ratios and percentages to one decimal place, except for per-share amounts. Round per-share amounts to two decimal places.): Year 3…arrow_forward
arrow_back_ios
SEE MORE QUESTIONS
arrow_forward_ios
Recommended textbooks for you
 Managerial AccountingAccountingISBN:9781337912020Author:Carl Warren, Ph.d. Cma William B. TaylerPublisher:South-Western College Pub
 Financial AccountingAccountingISBN:9781337272124Author:Carl Warren, James M. Reeve, Jonathan DuchacPublisher:Cengage Learning
 Financial AccountingAccountingISBN:9781305088436Author:Carl Warren, Jim Reeve, Jonathan DuchacPublisher:Cengage Learning
 Managerial Accounting: The Cornerstone of Busines...AccountingISBN:9781337115773Author:Maryanne M. Mowen, Don R. Hansen, Dan L. HeitgerPublisher:Cengage Learning
Managerial Accounting
Accounting
ISBN:9781337912020
Author:Carl Warren, Ph.d. Cma William B. Tayler
Publisher:South-Western College Pub
Financial Accounting
Accounting
ISBN:9781337272124
Author:Carl Warren, James M. Reeve, Jonathan Duchac
Publisher:Cengage Learning
Financial Accounting
Accounting
ISBN:9781305088436
Author:Carl Warren, Jim Reeve, Jonathan Duchac
Publisher:Cengage Learning
Managerial Accounting: The Cornerstone of Busines...
Accounting
ISBN:9781337115773
Author:Maryanne M. Mowen, Don R. Hansen, Dan L. Heitger
Publisher:Cengage Learning
Financial ratio analysis; Author: The Finance Storyteller;https://www.youtube.com/watch?v=MTq7HuvoGck;License: Standard Youtube License