
(a)
Equation that relate planned spending to output and real rate of interest.
(a)
Explanation of Solution
The planned aggregate expenditure is the sum of consumption, planned investment, government spending, and net export. The equation that connects the planned spending to output and real rate interest can be derived as follows:
Thus, the equation for PAE is derived as
(b)
Construction of a table shows the relation of equilibrium output in the short run and inflation rate.
(b)
Explanation of Solution
The equation for PAE is derived as
Thus, the autonomous expenditure is 4,890.
The equilibrium output in the short run can be calculate by fix PAE equal to the output (Y). When the inflation rate is 0.0 and rate of interest is 0.02, Y is calculated by substituting the equation
Thus, the equilibrium output in the short run is 12,225.
Similarly, substitute each values of the rate of interest in the equation
Table 1
| Rate of inflation | Real inflation rate | Autonomous expenditure | Equilibrium output |
| 0 | 0.02 | 4,890 | 12,225 |
| 0.01 | 0.03 | 4,860 | 12,150 |
| 0.02 | 0.04 | 4,830 | 12,075 |
| 0.03 | 0.05 | 4,800 | 12,000 |
| 0.04 | 0.06 | 4,770 | 11,925 |
With the equilibrium output, the aggregate demand curve is graphically represented as below:
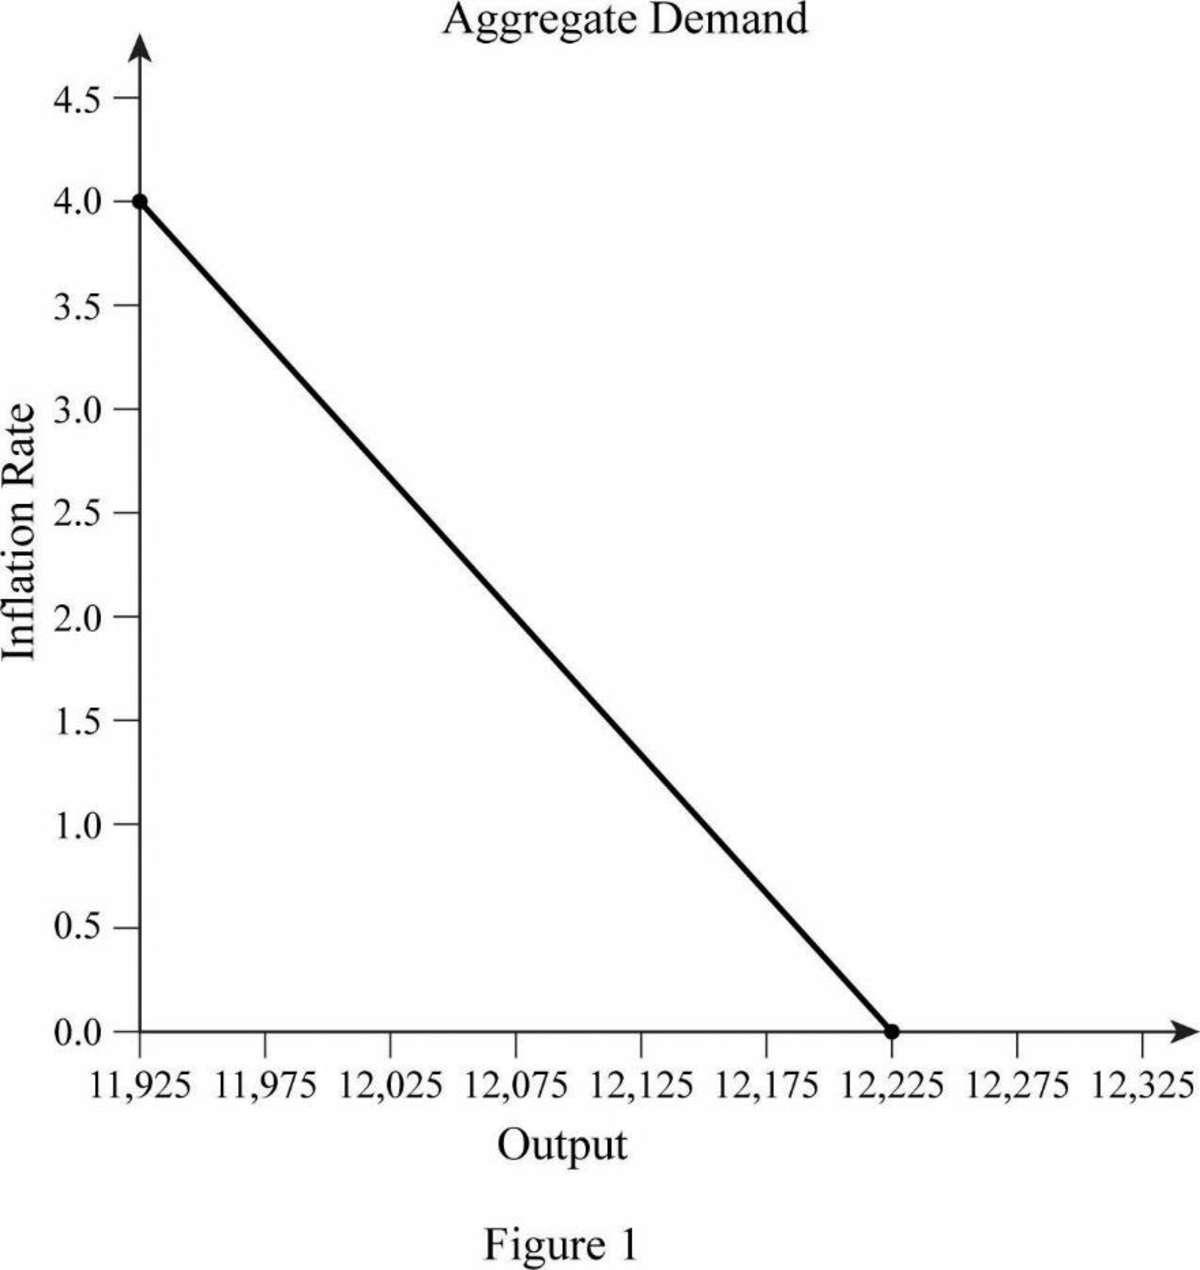
In Figure 1, the horizontal axis represents output and the vertical axis represents the rate of inflation. Curve AD is the aggregate demand curve, which refers to the total value of the goods and services that are demanded at each price or inflation rate in a given period of time.
(c)
Impact of increasing government purchases and construction of a table shows the relation of equilibrium output in the short run and inflation rate.
(c)
Explanation of Solution
The planned aggregate expenditure is the sum of consumption, planned investment, government spending, and net export. The equation that connects the planned spending to output and real rate interest is derived as follows:
Thus, the equation for PAE is derived as
Thus, the autonomous expenditure is 4,990.
The equilibrium output in the short run is calculated by fix PAE equal to the output (Y). When the inflation rate is 0.0 and rate of interest is 0.02, Y is calculated by substituting equation
Thus, the equilibrium output in the short run is 12,475.
Similarly, substitute each values of the rate of interest in the equation
Table 1
| Inflation Rate | Real Interest Rate | Autonomous Expenditure | Equilibrium Output |
| 0 | 0.02 | 4,990 | 12,475 |
| 0.01 | 0.03 | 4,960 | 12,400 |
| 0.02 | 0.04 | 4,930 | 12,325 |
| 0.03 | 0.05 | 4,900 | 12,250 |
| 0.04 | 0.06 | 4,870 | 12,175 |
With the equilibrium output, the aggregate demand curve is graphically represented as below:
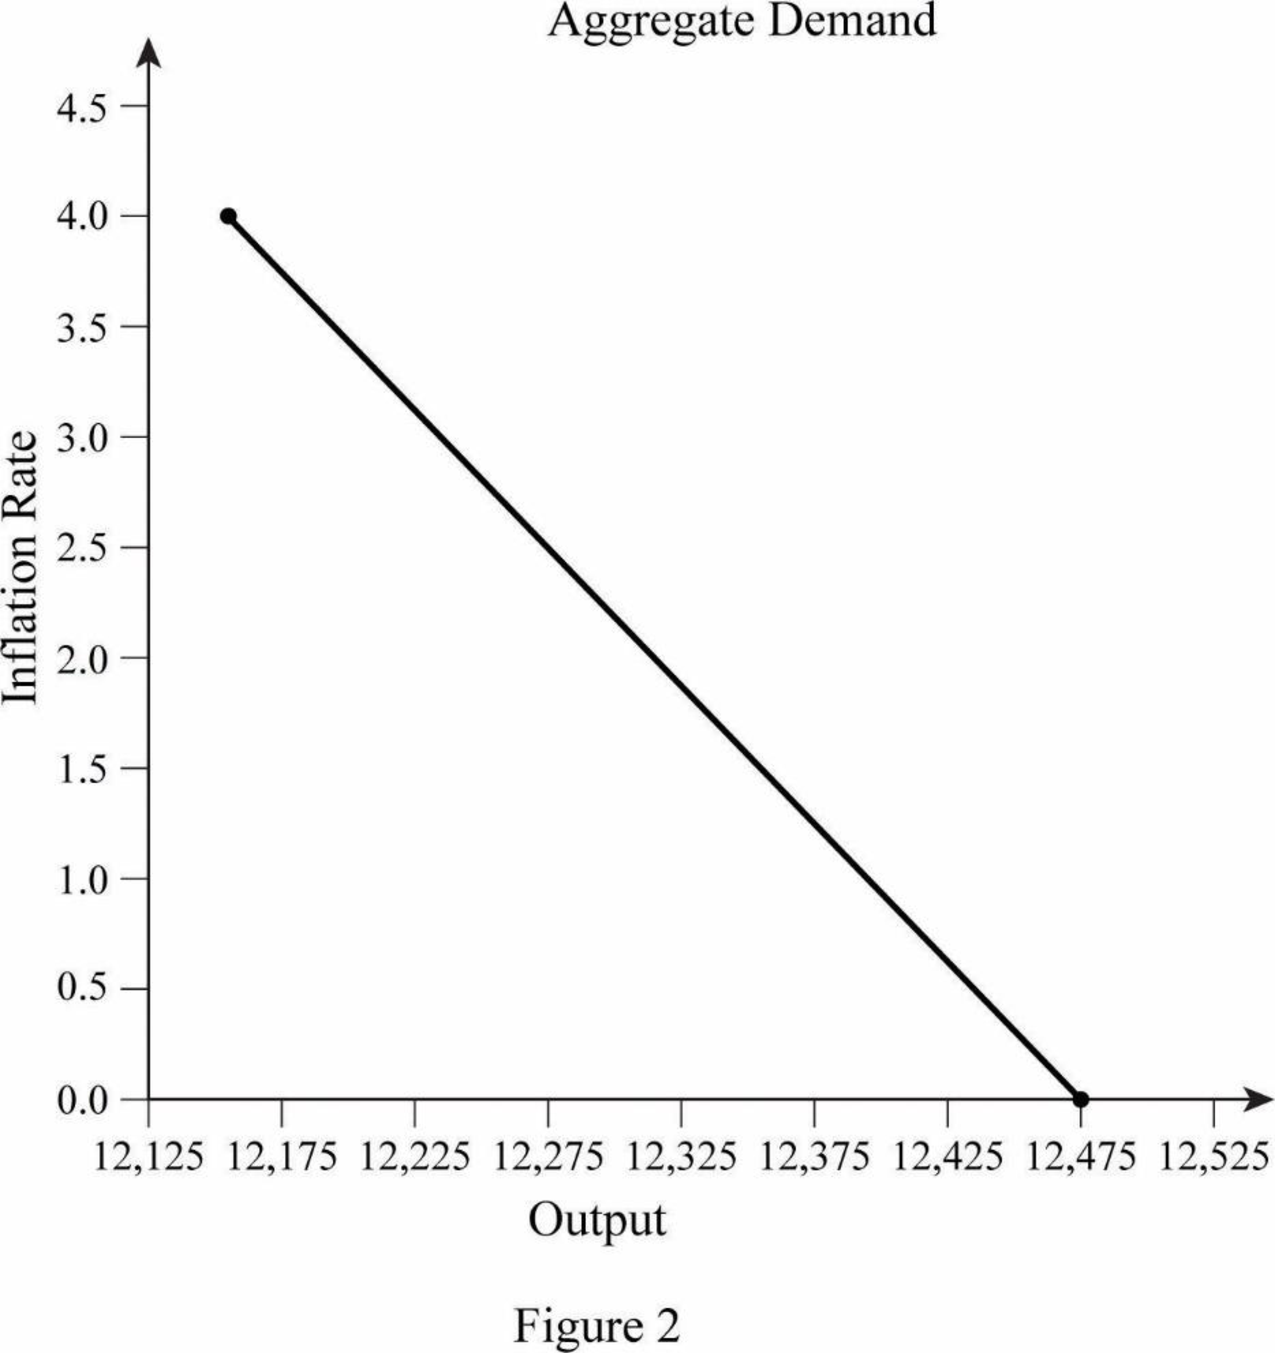
In Figure 2, the horizontal axis represents output and the vertical axis represents the rate of inflation. Curve AD is the aggregate demand curve, which refers to the total value of the goods and services that are demanded at each price or inflation rate in a given period of time.
Want to see more full solutions like this?
Chapter 15 Solutions
PRINCIPLES OF MACROECONOMICS(LOOSELEAF)

- In an economy of three sectors, assumed that : C= 400 + 0.75YD T= 400 I=300 G=400 All the variables are in RM Million. a) Based on the above information complete the table below. National Income Consumer Savings Aggregate Expenditure 3000 8000 Please provide me with the full answers with the working of the calculation so that I could learn it better. Thanks in advance.arrow_forwardIf nominal GDP rises from $100 trillion to $120 trillion, while the GDP deflator rises from 2.0 to 2.2, the percentage change in real GDP is approximately equal to A) -10%. B) 0%. C) 10%. D) 20%. E) 30%.arrow_forwardA certain country's GDP (total monetary value of all finished goods and services produced in that country) can be approximated by g(t) = 2,000-420e 0.07t billion dollars per year (0 ≤t≤ 5), where t is time in years since January 2010. Find an expression for the total GDP G(t) of sold goods in this country from January 2010 to time t. HINT: [Use the shortcuts.] G(t) = Estimate, to the nearest billion dollars, the country's total GDP from January 2010 through June 2014. (The actual value was 7,321 billion dollars.) Xbillion dollarsarrow_forward
- To answer Questions #1 through #4 use the following information: Suppose that in the nation state of Raleighville there are 2 final goods produced in the economy - dog food and kitten chow. Suppose the economy produces 15 units of dog food and 5 units of kitten chow in 2000 (the base year), and 20 units of dog food and 10 units of kitten chow in 2020. Further suppose the price of dog food was $1.00 per unit in 2000, and $3.00 per unit in 2020; whereas the price of kitten chow was $1.00 in 2000 and $2.50 in 2020. What was the nominal GDP for Raleighville in 2000? O a. $20.00 O b. $30.00 $57.50 O d. $85.00 Next pagearrow_forwardTo answer Questions #1 through #4 use the following information: Suppose that in the nation state of Raleighville there are 2 final goods produced in the economy - dog food and kitten chow. Suppose the economy produces 15 units of dog food and 5 units of kitten chow in 2000 (the base year), and 20 units of dog food and 10 units of kitten chow in 2020. Further suppose the price of dog food was $1.00 per unit in 2000, and $3.00 per unit in 2020; whereas the price of kitten chow was $1.00 in 2000 and $2.50 in 2020. What was the real GDP for Raleighville in 2020? Oa. $20.00 O b. $30.00 Oc. $57.50 Od. $85.00 Next page pagearrow_forwardTo answer Questions #1 through #4 use the following information: Suppose that in the nation state of Raleighville there are 2 final goods produced in the economy - dog food and kitten chow. Suppose the economy produces 15 units of dog food and 5 units of kitten chow in 2000 (the base year), and 20 units of dog food and 10 units of kitten chow in 2020. Further suppose the price of dog food was $1.00 per unit in 2000, and $3.00 per unit in 2020; whereas the price of kitten chow was $1.00 in 2000 and $2.50 in 2020. The GDP deflator for Raleighville, for 2020, is and it follows that Raleighville experienced between 2000 and 2020. O a. 150.0; deflation O b. 150.0; inflation O C. 283.33; inflation O d. 333.33; inflation age Next pagearrow_forward
- To answer Questions #1 through #4 use the following information: Suppose that in the nation state of Raleighville there are 2 final goods produced in the economy - dog food and kitten chow. Suppose the economy produces 15 units of dog food and 5 units of kitten chow in 2000 (the base year), and 20 units of dog food and 10 units of kitten chow in 2020. Further suppose the price of dog food was $1.00 per unit in 2000, and $3.00 per unit in 2020; whereas the price of kitten chow was $1.00 in 2000 and $2.50 in 2020. What was the real GDP for Raleighville in 2000? O a. $20.00 O b. $30.00 O c. $57.50 O d. $85.00 Next pagearrow_forwardThe economy of Ghana has a saving function S= - 100 +0.2Y, investment equal to 66, government expenditure equal to 50, export equal to 20 and an import function of M= 0.1Y. (a). What is the consumption function of the economy (b). What is the aggregate expenditure function of the economy?arrow_forwardAn economy produces capital and consumer goods. Discuss the impact on the PFF due to the following: a) The discovery of a new source of oil. b) The unemployment rate in the economy has decreased by 5%. c) Improved technology that impacts the production of capital goods.arrow_forward
- Suppose that the following equations describe the economy of the country of the Philippines.C= 500 + 0.8 (Y – T), I= 200, G= 300, NX= 50, T= 200, Yf= 5000; where C=consumption level, I=investment, G=government expenditures, NX=net exports, T=taxes and Yf=full employment output/income.Use this information to find each of the following:4.1. Investment, government and tax multiplier.4.2. Equilibrium output/income.4.3. The output gap.4.4. By how much would government expenditures have to change to eliminate the output gap?arrow_forwardConsider an economy described by the following equations:Y=C + I +GY=7,000G=4000T=2,000C=150+0.75(Y-T)I=1,000-50rc. Now suppose the G rises by 1,000. Compute private saving, public saving, andnational saving and show a graphical representation of your answer.arrow_forwardQuestion 4: ( Suppose an economy is in its steady state with k = 49.38. Imagine it has the following characteristics: Alpha: a = 0.7 Savings Rate: s = 0.4 Population Growth Rate: n = 0.05 Depreciation Rate: 8 = 0.075 Level of Technology: Ao = 1.5 a) f | Calculate steady-state per-capita production and steady state per-capita consumption of this econurty.arrow_forward

 Principles of Economics (12th Edition)EconomicsISBN:9780134078779Author:Karl E. Case, Ray C. Fair, Sharon E. OsterPublisher:PEARSON
 Engineering Economy (17th Edition)EconomicsISBN:9780134870069Author:William G. Sullivan, Elin M. Wicks, C. Patrick KoellingPublisher:PEARSON
 Principles of Economics (MindTap Course List)EconomicsISBN:9781305585126Author:N. Gregory MankiwPublisher:Cengage Learning
 Managerial Economics: A Problem Solving ApproachEconomicsISBN:9781337106665Author:Luke M. Froeb, Brian T. McCann, Michael R. Ward, Mike ShorPublisher:Cengage Learning
 Managerial Economics & Business Strategy (Mcgraw-...EconomicsISBN:9781259290619Author:Michael Baye, Jeff PrincePublisher:McGraw-Hill Education