
Videos
The comparative balance sheet of Prime Sports Gear, Inc., at December 31, the end of the fiscal year, is as follows:
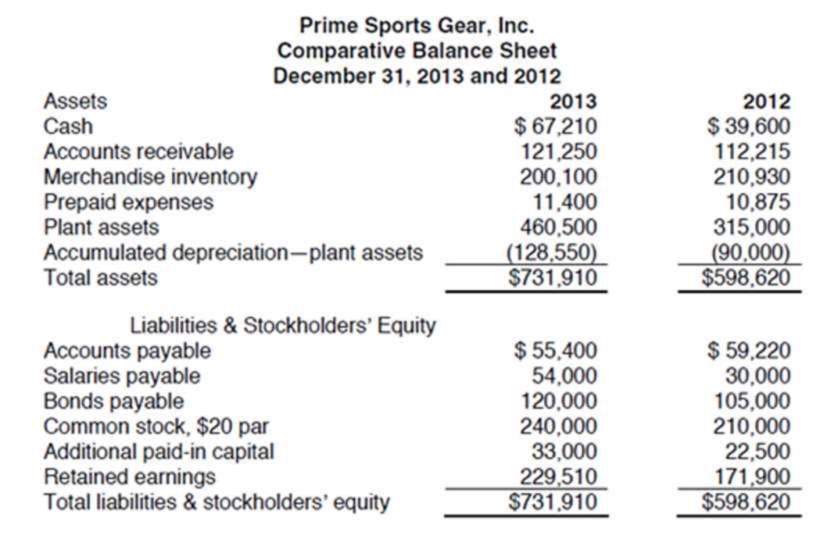
Additional data obtained from the records of Prime Sports Gear are as follows:
- a. Net income for 2013 was $121,610.
- b.
Depreciation reported on income statement for 2013 was $46,500. - c. Purchased $165,000 of new equipment, putting $90,000 cash down and issuing $75,000 of bonds for the balance.
- d. Old equipment originally costing $19,500, with
accumulated depreciation of $7,950, was sold for $8,000. - e. Retired $60,000 of bonds.
- f. Declared cash dividends of $64,000.
- g. Issued 1,500 shares of common stock at $27 cash per share.
Open the file CASHFLOW from the website for this book at cengagebrain.com. First, enter the formulas. Then, complete the worksheet in the manner described next.
According to the problem, cash increased from $39,600 to $67,210 during the year. This is a $27,610 increase. To record this increase on the worksheet, move to row 17. Since this is the first account you are analyzing, enter the letter a in column C. Then enter 27610 in column D (a debit since cash increased). This brings the year-end balance (column G) to $67,210, its proper balance.
Now move to the bottom part of the statement where you see the categories Operating Activities, Investing Activities, and so on. The credit side of the entry has to be entered here.
The proper space for this cash entry is on row 59. Enter the letter a in cell E59 and 27610 in cell F59. Notice the totals at the bottom of the page (row 60) now agree.
The next account balance that changed is accounts receivable. It increased by $9,035. To enter this change on the worksheet, enter the letter b in cell C18 and 9035 in cell D18 (again, a debit since accounts receivable increased). This brings the year-end balance in column G to $121,250, its proper balance. The change in accounts receivable balance is an operating activity adjustment (as explained in your textbook). Enter the credit side of this entry in cells E34 and F34, and enter the explanation Increase in accounts receivable in cell A34. Note: Your textbook probably shows “Net income” as the first item under Operating Activities. We will get to that later. The sequence in which you enter items on this worksheet is not important.
All other balance sheet accounts must be analyzed in the same manner, placing appropriate debit or credit entries in the top part of the worksheet to obtain the proper balances in column G, and then entering the second side of the entry in the appropriate row on the bottom part of the worksheet. You should use letter references to identify all entries. Also, you must enter a description of the entry in column A under the appropriate activity category. Although a sequence of analyzing the balance sheet from top to bottom is suggested here, this order is not necessary. As mentioned earlier, your textbook may specify a different sequence. Also, note that some accounts may have both debit and credit adjustments to them.
The worksheet is not a substitute for a statement of cash flows, but it does provide you with all the numbers you need to properly prepare one.
You will be done with your analysis when:
- a. The individual account balances at December 31, 2013, as shown on the worksheet (column G) equal those shown in the given problem data.
- b. The transaction column totals are equal (cells D60 and F60).
- c. The sum of the operating, investing, and financing activities (cell G59) equals the change in cash (cell D59 or F59).
When you are finished, enter your name in cell A1. Save your completed file as CASHFLOW2. Print the worksheet when done. Also print your formulas. Check figure: Total credits at 12/31/2013 (cell G31), $860,460.
Want to see the full answer?
Check out a sample textbook solution
Chapter 14 Solutions
Excel Applications for Accounting Principles


- The comparative balance sheet of Prime Sports Gear, Inc., at December 31, the end of the fiscal year, is as follows: Additional data obtained from the records of Prime Sports Gear are as follows: a. Net income for 2013 was 121,610. b. Depreciation reported on income statement for 2013 was 46,500. c. Purchased 165,000 of new equipment, putting 90,000 cash down and issuing 75,000 of bonds for the balance. d. Old equipment originally costing 19,500, with accumulated depreciation of 7,950, was sold for 8,000. e. Retired 60,000 of bonds. f. Declared cash dividends of 64,000. g. Issued 1,500 shares of common stock at 27 cash per share. You have been asked to prepare a statement of cash flows for Prime Sports Gear for 2013. Review the worksheet called CASHFLOW that has been provided to assist you in preparing the statement. The worksheet has been designed so that as you make entries in columns D and F, column G will be automatically updated. For example, FORMULA1 should be entered as =B17+D17F17. Columns C and E are to be used to enter letter references for each of the debit and credit entries on the worksheet.arrow_forwardFinancial information for Powell Panther Corporation is shown below: Powell Panther Corporation: Income Statements for Year Ending December 31 (Millions of Dollars) 2018 Sales $ 1,625.0 $ 2017 1,300.0 Operating costs excluding depreciation and amortization 1,300.0 1,105.0 EBITDA $ 325.0 $ 195.0 Depreciation and amortization 39.0 31.0 Earnings before interest and taxes (EBIT) $ 286.0 $ 164.0 Interest 36.0 29.0 Earnings before taxes (EBT) $ 250.0 $ 135.0 Taxes (40%) 100.0 54.0 Net income $ 150.0 $ 81.0 Common dividends $ 135.0 $ 65.0 Powell Panther Corporation: Balance Sheets as of December 31 (Millions of Dollars) 2018 Assets Cash and equivalents $ 23.0 $ 2017 18.0 Accounts receivable 164.0 143.0 Inventories 343.0 312.0 Total current assets $ 530.0 $ 473.0 Net plant and equipment 390.0 312.0 Total assets $ 920.0 $ 785.0 Liabilities and Equity…arrow_forwardCardinal Industries had the following operating results for 2018: Sales = $34,318; Cost of goods sold = $24,212; Depreciation expense = $5,997; Interest expense = $2,710; Dividends paid = $1,996. At the beginning of the year, net fixed assets were $19,940, current assets were $7,054, and current liabilities were $3,992. At the end of the year, net fixed assets were $24,502, current assets were $8,684, and current liabilities were $4,673. The tax rate for 2018 was 22 percent. a. What is net income for 2018? (Do not round intermediate calculations.) b. What is the operating cash flow for 2018? (Do not round intermediate calculations.) c. What is the cash flow from assets for 2018? (Do not round intermediate calculations. A negative answer should be indicated by a minus sign.) d-1. If no new debt was issued during the year, what is the cash flow to creditors? (Do not round intermediate calculations.) d-2. If no new debt was issued during the year, what is the cash flow…arrow_forward
- Laflamme Inc. had the following operating results for 2018: sales $30,660; cost of goods sold = $20.260, depreciation expense = $5,660: interest expense = $3.090; dividends paid = $1,950. At the beginning of the year, net fixed assets were $17,480, current assets were $5.960, and current liabilities were $3.575. At the end of the year, net fixed assets were $21,160, current assets were $7,180, and current liabilities were $4,100. The tax rate for 2018 was 30 %. a. What is net income for 2018? (Negative answers should be indicated by a minus sign. Omit $ sign in your response.) Net income b. What is the operating cash flow for 2018? (Negative answers should be indicated by a minus sign. Omit $ sign in your response.) Operating cash flow c. What is the cash flow from assets for 2018? (Negative answer should be indicated by a minus sign. Omit $ sign in your response.) Cash flow from assets d. If no new debt was issued during the year, what is the cash flow to creditors? What is the cash…arrow_forwardConsider the following balance sheet for Go The Distance Trading Cards. Sales were $1,200,000 in the past year. Go The Distance Trading Cards Balance Sheet, 2013: Assets $ Current Assets $74,630.00 Net fixed Assets (Net PPE) $224,900.00 Total Assets $299,530.00 Liabilities and Shareholder Equity Current Liabilities $43,510.00 Long-term liabilities (Long term debt) $93,200.00 Total Liabilities $136,710.00 Shareholder equity $162,820.00 Total Liabilities and Shareholder Equity $299,530.00 What is the debt-to-asset ratio for this firm?arrow_forwardIvanhoe Automotive’s balance sheet at the end of its most recent fiscal year shows the following information: Ivanhoe AutomotiveBalance Sheet as of March 31, 2017 Assets: Liabilities and Equity: Cash and marketable sec. $40,000 Accounts payable and accruals $168,000 Accounts receivable 158,000 Notes payable 27,000 Inventory 232,000 Total current assets $430,000 Total current liabilities $195,000 Long-term debt 172,000 Total liabilities $367,000 Net plant and equipment 780,000 Common stock 317,000 Goodwill and other assets 92,000 Retained earnings 618,000 Total assets $1,302,000 Total liabilities and equity $1,302,000 In addition, it was reported that the firm had a net income of $159,000 on net sales of $4,200,000.Excel Template(Note: This template includes the problem statement as it appears in your textbook. The problem assigned to you here may have different values. When using…arrow_forward
- adux Candy Company's income statement for the year ended December 31, 2024, reported interest expense of $21 million and income tax expense of $11 million. Current assets listed in its balance sheet include cash, accounts receivable, and inventory. Property, plant, and equipment is the company's only noncurrent asset. Financial ratios for 2024 are listed below. Profitability and turnover ratios with balance sheet items in the denominator were calculated using year-end balances rather than averages. Debt to equity ratio Current ratio Acid-test ratio Times interest earned ratio Return on assets Return on equity Profit margin on sales. Gross profit margin (gross profit divided by net sales). Inventory turnover Receivables turnover Assets Current assets: Cash CADUX CANDY COMPANY Balance Sheet At December 31, 2024 (5 in millions) Accounts receivable (net) Inventory Total current assets Property, plant, and equipment (net) Total assets AL 1.0 2.0 1.0 Required: Prepare a December 31, 2024,…arrow_forwardCadux Candy Company's income statement for the year ended December 31, 2024, reported interest expense of $3 million and income tax expense of $20 million. Current assets listed in its balance sheet include cash, accounts receivable, and inventory. Property, plant, and equipment is the company's only noncurrent asset. Financial ratios for 2024 are listed below. Profitability and turnover ratios with balance sheet items in the denominator were calculated using year-end balances rather than averages. Debt to equity ratio Current ratio 0.8 2.0 Acid-test ratio Times interest earned ratio 1.0 16 times Return on assets 20% Return on equity 36% Profit margin on sales 10% Gross profit margin (gross profit divided by net sales) 20% Inventory turnover 8 times Receivables turnover 21 times Required: Prepare a December 31, 2024, balance sheet for the Cadux Candy Company. Note: Enter your answers in millions. Round your intermediate calculations and final answer to the nearest whole million. CADUX…arrow_forwardCadux Candy Company's income statement for the year ended December 31, 2024, reported interest expense of $3 million and income tax expense of $20 million. Current assets listed in its balance sheet include cash, accounts receivable, and inventory. Property, plant, and equipment is the company's only noncurrent asset. Financial ratios for 2024 are listed below. Profitability and turnover ratios with balance sheet items in the denominator were calculated using year-end balances rather than averages. Debt to equity ratio Current ratio 0.8 2.0 Acid-test ratio 1.0 Times interest earned ratio 16 times Return on assets 20% Return on equity 36% Profit margin on sales 10% Gross profit margin (gross profit divided by net sales) 20% Inventory turnover 8 times Receivables turnover 21 times Required: Prepare a December 31, 2024, balance sheet for the Cadux Candy Company. Note: Enter your answers in millions. Round your intermediate calculations and final answer to the nearest whole million. CADUX…arrow_forward
- The balance sheet of Huan Corporation reported net fixed assets of $332,000 at the end of 2018. The fixed- asset turnover ratio for 2018 was 4.0, and sales for the year totaled $1,540,000. Net fixed assets at the end of 2017 were: A. $491,000. B. $385,000. C. $438,000 D. $408,000arrow_forwardHere are simplified financial statements for Watervan Corporation: INCOME STATEMENT (Figures in $ millions) Net sales $ 893.00 Cost of goods sold 753.00 Depreciation 43.00 Earnings before interest and taxes (EBIT) $ 97.00 Interest expense 24.00 Income before tax $ 73.00 Taxes 15.33 Net income $ 57.67 BALANCE SHEET (Figures in $ millions) End of Year Start of Year Assets Current assets $ 381 $ 336 Long-term assets 282 234 Total assets $ 663 $ 570 Liabilities and shareholders’ equity Current liabilities $ 206 $ 169 Long-term debt 120 133 Shareholders’ equity 337 268 Total liabilities and shareholders’ equity $ 663 $ 570 The company’s cost of capital is 8.5%. a. Calculate Watervan’s economic value added (EVA). (Do not round intermediate calculations. Enter your answer in millions…arrow_forwardMartinez Industries had the following operating results for 2021: Sales = $34,318; Cost of goods sold = $24,212; Depreciation expense = $5,997; Interest expense = $2,710; Dividends paid = $1,996. At the beginning of the year, net fixed assets were $19,940, current assets were $7,054, and current liabilities were $3,992. At the end of the year, net fixed assets were $24,502, current assets were $8,684, and current liabilities were $4,673. The tax rate was 22 percent. a. What is net income for 2021? b. What is the operating cash flow for 2021? ( c. What is the cash flow from assets for 2021? d-1. If no new debt was issued during the year, what is the cash flow to creditors? ( d-2. If no new debt was issued during the year, what is the cash flow to stockholders?arrow_forward
 Excel Applications for Accounting PrinciplesAccountingISBN:9781111581565Author:Gaylord N. SmithPublisher:Cengage Learning