
Videos
a.
Find the
a.
Answer to Problem 69SE
The 95% confidence interval for the slope of the population regression is
Explanation of Solution
Given info:
The data represents the values of the variables height in feet and price in dollars for a sample of warehouses.
Calculation:
Linear regression model:
In a linear equation
A linear regression model is given as
Regression:
Software procedure:
Step by step procedure to obtain regression equation using MINITAB software is given as,
- Choose Stat > Regression > Fit Regression Line.
- In Response (Y), enter the column of Price.
- In Predictor (X), enter the column of Height.
- Click OK.
Output using MINITAB software is given below:
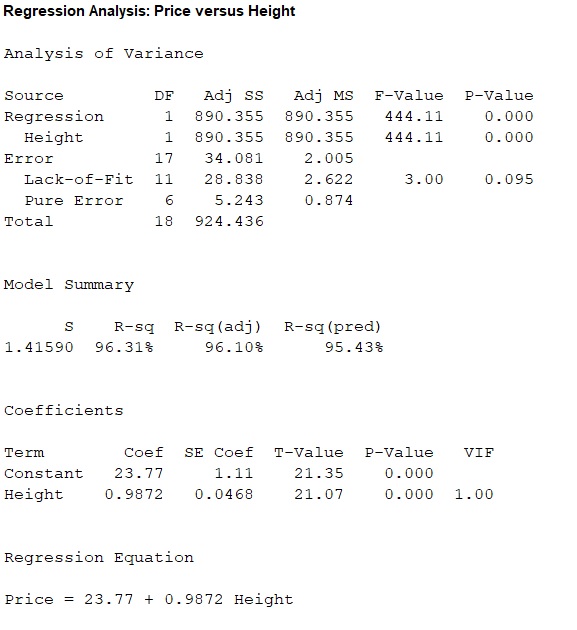
Thus, the regression line for the variables sale price
Therefore, the slope coefficient of the regression equation is
Confidence interval:
The general formula for the confidence interval for the slope of the regression line is,
Where,
From the MINITAB output, the estimate of error standard deviation of slope coefficient is
Since, the level of confidence is not specified. The prior confidence level 95% can be used.
Critical value:
For 95% confidence level,
Degrees of freedom:
The sample size is
The degrees of freedom is,
From Table A.5 of the t-distribution in Appendix A, the critical value corresponding to the right tail area 0.025 and 17 degrees of freedom is 2.110.
Thus, the critical value is
The 95% confidence interval is,
Thus, the 95% confidence interval for the slope of the population regression is
Interpretation:
There is 95% confident, that the expected change in sale price associated with 1 foot increase in height lies between $0.888452 and $1.085948.
c.
Find the interval estimate for the true mean sale price of all warehouses with 25 ft truss height.
c.
Answer to Problem 69SE
The 95% specified confidence interval for the true mean sale price of all warehouses with 25 ft truss height is
Explanation of Solution
Calculation:
Here, the regression equation is
Expected sale price when the height is 25 feet:
The expected sale price with 25 ft height ware houses is obtained as follows:
Thus, the expected sale price with 25 ft height ware houses is 48.45.
Confidence interval:
The general formula for the
Where,
From the MINITAB output in part (a), the value of the standard error of the estimate is
The value of
| i | Truss height x | |
| 1 | 12 | 144 |
| 2 | 14 | 196 |
| 3 | 14 | 196 |
| 4 | 15 | 225 |
| 5 | 15 | 225 |
| 6 | 16 | 256 |
| 7 | 18 | 324 |
| 8 | 22 | 484 |
| 9 | 22 | 484 |
| 10 | 24 | 576 |
| 11 | 24 | 576 |
| 12 | 26 | 676 |
| 13 | 26 | 676 |
| 14 | 27 | 729 |
| 15 | 28 | 784 |
| 16 | 30 | 900 |
| 17 | 30 | 900 |
| 18 | 33 | 1089 |
| 19 | 36 | 1296 |
| Total |
Thus, the total of truss height is
The mean truss height is,
Thus, the mean truss height is
Covariance term
The value of
Thus, the covariance term
Since, the level of confidence is not specified. The prior confidence level 95% can be used.
Critical value:
For 95% confidence level,
Degrees of freedom:
The sample size is
The degrees of freedom is,
From Table A.5 of the t-distribution in Appendix A, the critical value corresponding to the right tail area 0.025 and 17 degrees of freedom is 2.110.
Thus, the critical value is
The 95% confidence interval is,
Thus, the 95% specified confidence interval for the true mean of all warehouses with 25 ft truss height is
Interpretation:
There is 95% specified confidence interval for the true mean of all warehouses with 25 ft truss height lies between $47.730 and $49.172.
d.
Find the prediction interval of sale price for a single warehouse of truss height 25 ft.
Compare the width of the prediction interval with the confidence interval obtained in part (a).
d.
Answer to Problem 69SE
The 95% prediction interval of sale price for a single warehouse of truss height 25 ft is
The prediction interval is wider than the confidence interval.
Explanation of Solution
Calculation:
Here, the regression equation is
From part (c), the the expected sale price with 25 ft height ware houses is
Prediction interval for a single future value:
Prediction interval is used to predict a single value of the focus variable that is to be observed at some future time. In other words it can be said that the prediction interval gives a single future value rather than estimating the mean value of the variable.
The general formula for
where
From the MINITAB output in part (a), the value of the standard error of the estimate is
From part (c), the truss height is
Since, the level of confidence is not specified. The prior confidence level 95% can be used.
Critical value:
For 95% confidence level,
Degrees of freedom:
The sample size is
The degrees of freedom is,
From Table A.5 of the t-distribution in Appendix A, the critical value corresponding to the right tail area 0.025 and 17 degrees of freedom is 2.110.
Thus, the critical value is
The 95% prediction interval is,
Thus, the 95% prediction interval of sale price for a single warehouse of truss height 25 ft is
Interpretation:
For repeated samples, there is 95% confident that the sale price for a single warehouse of truss height 25 ft lies between $45.377 and $51.523.
Comparison:
The 95% prediction interval of sale price for a single warehouse of truss height 25 ft is
Width of the prediction interval:
The width of the 95% prediction interval is,
Thus, the width of the 95% prediction interval is 6.146.
The 95% specified confidence interval for the true mean of all warehouses with 25 ft truss height is
Width of the confidence interval:
The width of the 95% confidence interval is,
Thus, the width of the 95% confidence interval is 1.442.
From, the obtained two widths it is observed that the width of the prediction interval is typically larger than the width of the confidence interval.
Thus, the prediction interval is wider than the confidence interval.
e.
Compare the width of the 95% prediction interval of sale price of ware houses for 25 ft truss height and for 30 ft truss height.
e.
Answer to Problem 69SE
The 95% prediction interval of sale price of ware houses for 30 ft truss height will be wider than the sale price of ware houses for 25 ft truss height.
Explanation of Solution
Calculation:
Here, the regression equation is
From part (c), the truss height is
Here, the observation
The general formula to obtain
For
For
In the two quantities, the only difference is the values of
In general, the value of the quantity
Therefore, the value
Comparison:
Prediction interval:
The general formula for
The prediction interval will be wider for large value of
Here,
Thus, the prediction interval is wider for
Thus, 95% prediction interval of sale price of ware houses for 30 ft truss height will be wider than the sale price of ware houses for 25 ft truss height.
e.
Find the
e.
Answer to Problem 69SE
The
Explanation of Solution
Calculation:
The coefficient of determination (
The general formula to obtain coefficient of variation is,
From the regression output obtained in part (a), the value of coefficient of determination is 0.9631.
Thus, the coefficient of determination is
Correlation coefficient:
Correlation analysis is used to measure the strength of the association between variables. In other words, it can be said that correlation describes the linear association between quantitative variables.
The general formula to calculate correlation coefficient is,
The coefficient of determination is obtained as follows:
The sign of the correlation coefficient depends on the sign of the slope coefficient.
Here,
Since, the sign of the slope coefficient is positive. The correlation coefficient is positive.
Thus, the correlation coefficient is 0.9814.
Interpretation:
The strength of the association between the variables sale price and truss height is 0.9814. that is, 1 unit increase in one variable is associated with 98.14% increase in the value of the other variable.
Want to see more full solutions like this?
Chapter 12 Solutions
Probability and Statistics for Engineering and the Sciences


- Find the mean hourly cost when the cell phone described above is used for 240 minutes.arrow_forwardThe highway department wants to estimate the proportion of vehicles on Interstate 25 between the hours of midnight and 5:00 A.M. that are 18-wheel tractor trailers. The estimate will be used to determine highway repair and construction considerations and in highway patrol planning. Suppose researchers for the highway department counted vehicles at different locations on the interstate for several nights during this time period. Of the 3,263 vehicles counted, 1,009 were 18-wheelers.a. Determine the point estimate for the proportion of vehicles traveling Interstate 25 during this time period that are 18-wheelers.b. Construct a 99% confidence interval for the proportion of vehicles on Interstate 25 during this time period that are 18-wheelers.arrow_forwardAn ecologist hypothesizes a relationship between wing span of birds and the width of tree branches they use. The ecologist captured male birds, measured their wing span and other characteristics in millimeters, and then marked and released them. During the ensuing winter, the ecologist repeatedly observed the marked birds as they foraged for food on tree branches. He noted the branch diameter on each occasion, and calculated the average branch diameter for each bird in centimeters. The measurement data are below. What can the ecologist conclude with an a of 0.10? wing span branch diameter 79.3 80.1 80.7 81.5 79.5 80.7 81.1 80.5 80.7 1.02 1.04 1.21 1.15 1.21 1.56 1.39 1.31 1.39 a) What is the appropriate statistic? Select- Compute the statistic selected in a): b) Obtain/compute the appropriate values to make a decision about Ho- Critical Value - ; Test Statistic= Decision: -Select- c) Compute the corresponding effect size(s) and indicate magnitude(s). If not appropriate, input and/or…arrow_forward
 Glencoe Algebra 1, Student Edition, 9780079039897...AlgebraISBN:9780079039897Author:CarterPublisher:McGraw Hill
 College Algebra (MindTap Course List)AlgebraISBN:9781305652231Author:R. David Gustafson, Jeff HughesPublisher:Cengage Learning
 Big Ideas Math A Bridge To Success Algebra 1: Stu...AlgebraISBN:9781680331141Author:HOUGHTON MIFFLIN HARCOURTPublisher:Houghton Mifflin Harcourt
 Algebra: Structure And Method, Book 1AlgebraISBN:9780395977224Author:Richard G. Brown, Mary P. Dolciani, Robert H. Sorgenfrey, William L. ColePublisher:McDougal Littell
 Holt Mcdougal Larson Pre-algebra: Student Edition...AlgebraISBN:9780547587776Author:HOLT MCDOUGALPublisher:HOLT MCDOUGAL
 Functions and Change: A Modeling Approach to Coll...AlgebraISBN:9781337111348Author:Bruce Crauder, Benny Evans, Alan NoellPublisher:Cengage Learning