Essential Statistics
2nd Edition
ISBN: 9781259570643
Author: Navidi
Publisher: MCG
bartleby

Concept explainers

bartleby

Videos

Question
Book Icon
Chapter 8.4, Problem 9E

a.

To determine

Find the sample proportion p^.

a.

Expert Solution
Check Mark

Answer to Problem 9E

The value of sample proportion p^ is 0.675.

Explanation of Solution

In a simple random sample of 80 individuals, only 54 individuals are in the group of interest.

The sample proportion p^ is:

p^=xn

Where, x be the number of observations, n be the sample size.

Substitute the corresponding values to get the proportion,

p^=5480=0.675

Thus, the sample proportion p^ is 0.675.

b.

To determine

Check whether the assumptions for the hypothesis test are satisfied.

b.

Expert Solution
Check Mark

Answer to Problem 9E

Yes, the assumptions for the hypothesis test are satisfied.

Explanation of Solution

Assumptions for performing a hypothesis test for a population proportion:

  • The samples taken from the population are simple random samples.
  • The population is at least 20 times as large as the sample.
  • The samples in the population are divided into two categories.
  • The values of np^0 and nq^0 should be greater than or equal to 10.

Requirement check:

  • The sample of 80 is obtained by simple random sampling.
  • The information about the population size is not known. The population size is assumed to be more than 20 times as large as the sample.
  • The samples in the population seemed to be categorized into two parts. That is, individuals under the category of interest and individuals not under the category of interest.
  • Verify the condition: np^010 and nq^010

  Substitute n as 80 and p^0 as 0.675,

  np^0=80(0.675)=54>10

  Substitute n as 80 and q^0 as 0.325(=1p^0),

  nq^0=80(0.325)=26>10

Therefore, all the conditions are satisfied.

c.

To determine

Find the value of test statistic.

c.

Expert Solution
Check Mark

Answer to Problem 9E

The value of test statistic is –2.8.

Explanation of Solution

Calculation:

Denote p as the true population proportion.

The given test hypotheses are:

Null hypothesis:

 H0:p=0.8.

That is, the true proportion of the individuals under the category of interest is 0.8.

Alternate hypothesis:

H1:p<0.8.

That is, the true proportion of the individuals under the category of interest is less than 0.8.

Test statistic:

The z-test statistic is:

z=p^p0p0(1p0)n,

Where, p^ be the sample proportion, p0 be the population proportion and n be the sample size.

Software procedure:

Step by step procedure to find the test statistic using the MINITAB software:

  • Choose Stat > Basic Statistics > 1-Proportion.
  • In Number of trials, enter the Sample size as 80 and in Number of Events, Enter Number of observations as 54.
  • Enter Hypothesized proportion as 0.8.
  • Select Options.
  • Choose Proportion<hypothesized proprotion in Alternative hypothesis.
  • Click OK in all dialogue boxes.

The output using Minitab is given below:

Essential Statistics, Chapter 8.4, Problem 9E

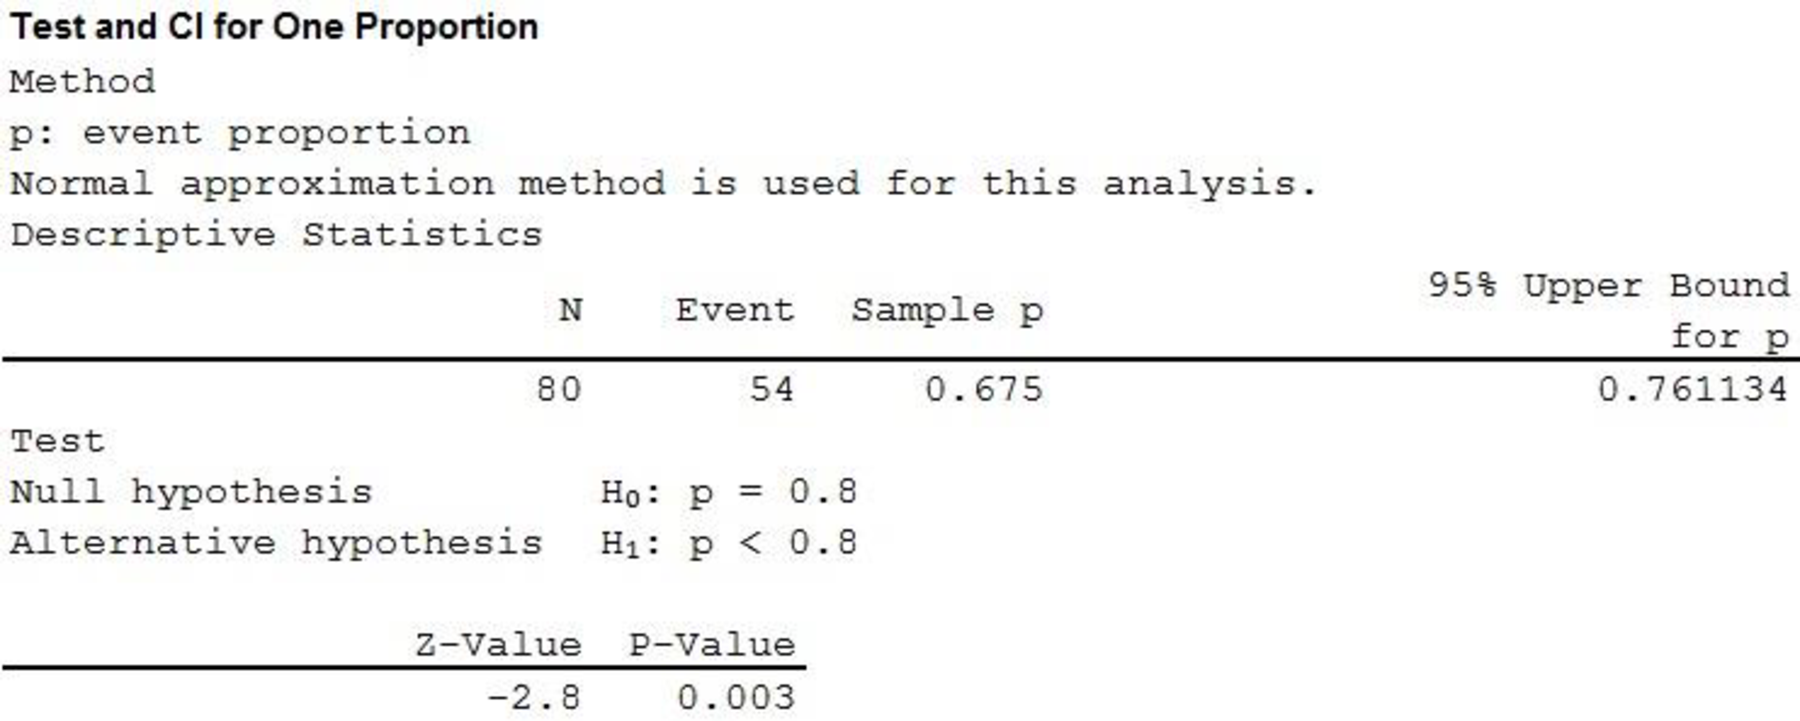
From the MINITAB output, the test statistic, that is, the z-value is –2.8.

Thus, the value of test statistic z is –2.8.

d.

To determine

Decide whether the null hypothesis H0 is rejected at α=0.05 level.

d.

Expert Solution
Check Mark

Answer to Problem 9E

The null hypothesis H0 is rejected at α=0.05 level.

Explanation of Solution

From previous part (c), it has been found that the value of test statistic z is –2.80.

From the given hypothesis, the alternative hypothesis contains the less than (<) symbol. Thus, it is clear that the hypothesis conducts the left-tailed test.

From Table 8.1 “Table of Critical Values”, the critical value for left-tailed test at α=0.05 level is –1.645.

For left-tailed test, the critical region will be the observed values which lie below the critical value of –1.645.

Therefore, the critical region is z1.645.

For left-tailed test:  If zzα, reject H0.

For right-tailed test:  If zzα, reject H0.

For two-tailed test:  If zzα2orzzα2, reject H0.

Conclusion:

The critical value at α=0.05 level is –1.645 and the test statistic is –2.80.

Here, the test statistic value of –2.80 is less than –1.645, that is, lies in the critical region.

That is, z(=2.80)<zα(=1.645).

Therefore, the null hypothesis is rejected.

Hence, there is evidence that the true proportion of the individuals under the category of interest is less than 0.80.

Want to see more full solutions like this?

Subscribe now to access step-by-step solutions to millions of textbook problems written by subject matter experts!

Chapter 8 Solutions

Essential Statistics

Ch. 8.1 - In Exercises 9–12, determine whether the statement...Ch. 8.1 - In Exercises 9–12, determine whether the statement...Ch. 8.1 - Prob. 13ECh. 8.1 - Practicing the Skills In Exercises 13–16,...Ch. 8.1 - Prob. 15ECh. 8.1 - Practicing the Skills In Exercises 13–16,...Ch. 8.1 - Prob. 17ECh. 8.1 - Prob. 18ECh. 8.1 - Prob. 19ECh. 8.1 - Prob. 20ECh. 8.1 - Working with the Concepts 21. Fertilizer: A new...Ch. 8.1 - 22. Big fish: A sample of 100 flounder of a...Ch. 8.1 - Prob. 23ECh. 8.1 - 24. Coffee: The mean caffeine content per cup of...Ch. 8.1 - Prob. 25ECh. 8.1 - Prob. 26ECh. 8.1 - 27. Type I error: A company that manufactures...Ch. 8.1 - Prob. 28ECh. 8.1 - Prob. 29ECh. 8.1 - Prob. 30ECh. 8.2 - Prob. 1CYUCh. 8.2 - Prob. 2CYUCh. 8.2 - Prob. 3CYUCh. 8.2 - Prob. 4CYUCh. 8.2 - Prob. 5CYUCh. 8.2 - Prob. 6CYUCh. 8.2 - Prob. 7CYUCh. 8.2 - Prob. 8CYUCh. 8.2 - Prob. 9CYUCh. 8.2 - Prob. 10CYUCh. 8.2 - Prob. 11CYUCh. 8.2 - Prob. 12CYUCh. 8.2 - 13. For each of the following P-values, state...Ch. 8.2 - Prob. 14CYUCh. 8.2 - Prob. 15CYUCh. 8.2 - Prob. 16CYUCh. 8.2 - Prob. 17CYUCh. 8.2 - Prob. 18CYUCh. 8.2 - Prob. 19CYUCh. 8.2 - Prob. 20CYUCh. 8.2 - Prob. 21CYUCh. 8.2 - A certain type of calculator battery has a mean...Ch. 8.2 - Prob. 23ECh. 8.2 - Prob. 24ECh. 8.2 - Prob. 25ECh. 8.2 - Prob. 26ECh. 8.2 - Prob. 27ECh. 8.2 - Prob. 28ECh. 8.2 - Prob. 29ECh. 8.2 - Prob. 30ECh. 8.2 - Prob. 31ECh. 8.2 - Prob. 32ECh. 8.2 - Prob. 33ECh. 8.2 - In Exercises 29–34, determine whether the...Ch. 8.2 - Prob. 35ECh. 8.2 - Prob. 36ECh. 8.2 - Prob. 37ECh. 8.2 - Prob. 38ECh. 8.2 - Prob. 39ECh. 8.2 - Prob. 40ECh. 8.2 - Prob. 41ECh. 8.2 - Prob. 42ECh. 8.2 - Prob. 43ECh. 8.2 - Prob. 44ECh. 8.2 - Prob. 45ECh. 8.2 - Prob. 46ECh. 8.2 - Prob. 47ECh. 8.2 - Prob. 48ECh. 8.2 - Prob. 49ECh. 8.2 - Prob. 50ECh. 8.2 - Prob. 51ECh. 8.2 - Prob. 52ECh. 8.2 - Prob. 53ECh. 8.2 - Prob. 54ECh. 8.2 - Prob. 55ECh. 8.2 - Prob. 56ECh. 8.2 - Prob. 57ECh. 8.2 - Prob. 58ECh. 8.2 - Prob. 59ECh. 8.2 - Prob. 60ECh. 8.2 - Prob. 61ECh. 8.2 - Prob. 62ECh. 8.2 - Prob. 63ECh. 8.2 - Prob. 64ECh. 8.2 - Prob. 65ECh. 8.2 - Prob. 66ECh. 8.2 - Prob. 67ECh. 8.2 - Prob. 68ECh. 8.2 - Prob. 69ECh. 8.2 - Prob. 70ECh. 8.2 - Prob. 71ECh. 8.2 - Prob. 72ECh. 8.3 - Prob. 1CYUCh. 8.3 - Prob. 2CYUCh. 8.3 - Prob. 3CYUCh. 8.3 - Prob. 4CYUCh. 8.3 - Prob. 5CYUCh. 8.3 - Prob. 6CYUCh. 8.3 - Prob. 7ECh. 8.3 - In Exercises 7 and 8, fill in each blank with the...Ch. 8.3 - Prob. 9ECh. 8.3 - Prob. 10ECh. 8.3 - Prob. 11ECh. 8.3 - Prob. 12ECh. 8.3 - Prob. 13ECh. 8.3 - Prob. 14ECh. 8.3 - Prob. 15ECh. 8.3 - Prob. 16ECh. 8.3 - Prob. 17ECh. 8.3 - Prob. 18ECh. 8.3 - Prob. 19ECh. 8.3 - Prob. 20ECh. 8.3 - Prob. 21ECh. 8.3 - How much is in that can? A machine that fills...Ch. 8.3 - Credit card debt: Following arc outstanding credit...Ch. 8.3 - Prob. 24ECh. 8.3 - Prob. 25ECh. 8.3 - Prob. 26ECh. 8.3 - Prob. 27ECh. 8.3 - Prob. 28ECh. 8.3 - Prob. 29ECh. 8.3 - Prob. 30ECh. 8.3 - Prob. 31ECh. 8.3 - Prob. 32ECh. 8.3 - Prob. 33ECh. 8.3 - Prob. 34ECh. 8.3 - Prob. 35ECh. 8.3 - Prob. 36ECh. 8.3 - Prob. 37ECh. 8.3 - Prob. 38ECh. 8.3 - Prob. 39ECh. 8.3 - Prob. 40ECh. 8.3 - Prob. 41ECh. 8.4 - Prob. 1CYUCh. 8.4 - Prob. 2CYUCh. 8.4 - Prob. 3CYUCh. 8.4 - A Gallup poll taken in December 2009 sampled 1000...Ch. 8.4 - Prob. 5ECh. 8.4 - Prob. 6ECh. 8.4 - Prob. 7ECh. 8.4 - In Exercises 7 and 8, determine whether the...Ch. 8.4 - Prob. 9ECh. 8.4 - Prob. 10ECh. 8.4 - Prob. 11ECh. 8.4 - Prob. 12ECh. 8.4 - Prob. 13ECh. 8.4 - Prob. 14ECh. 8.4 - Prob. 15ECh. 8.4 - Prob. 16ECh. 8.4 - Prob. 17ECh. 8.4 - Prob. 18ECh. 8.4 - Prob. 19ECh. 8.4 - Prob. 20ECh. 8.4 - Prob. 21ECh. 8.4 - Prob. 22ECh. 8.4 - Prob. 23ECh. 8.4 - Prob. 24ECh. 8.4 - Prob. 25ECh. 8.4 - Interpret calculator display: The following...Ch. 8.4 - Prob. 27ECh. 8.4 - Prob. 28ECh. 8.4 - Prob. 29ECh. 8.4 - Who will you vote for? A simple random sample of...Ch. 8.4 - Prob. 31ECh. 8.4 - Prob. 32ECh. 8.4 - Prob. 33ECh. 8.5 - Prob. 1CYUCh. 8.5 - Prob. 2CYUCh. 8.5 - Prob. 3CYUCh. 8.5 - Prob. 4CYUCh. 8.5 - Prob. 5ECh. 8.5 - Prob. 6ECh. 8.5 - Prob. 7ECh. 8.5 - Prob. 8ECh. 8.5 - Prob. 9ECh. 8.5 - Prob. 10ECh. 8.5 - Prob. 11ECh. 8.5 - Prob. 12ECh. 8.5 - Prob. 13ECh. 8.5 - Prob. 14ECh. 8.5 - Mercury pollution: Mercury is a toxic metal that...Ch. 8.5 - Ladies’ shoes: A random sample of 100 pairs of...Ch. 8 - Prob. 1CQCh. 8 - Prob. 2CQCh. 8 - Prob. 3CQCh. 8 - Prob. 4CQCh. 8 - Prob. 5CQCh. 8 - Prob. 6CQCh. 8 - Prob. 7CQCh. 8 - Prob. 8CQCh. 8 - Prob. 9CQCh. 8 - Prob. 10CQCh. 8 - Prob. 11CQCh. 8 - Prob. 12CQCh. 8 - Prob. 13CQCh. 8 - Prob. 14CQCh. 8 - Prob. 15CQCh. 8 - Prob. 1RECh. 8 - Prob. 2RECh. 8 - Prob. 3RECh. 8 - Prob. 4RECh. 8 - Prob. 5RECh. 8 - Prob. 6RECh. 8 - Prob. 7RECh. 8 - Prob. 8RECh. 8 - Prob. 9RECh. 8 - Prob. 10RECh. 8 - Interpret calculator display: The following TI-84...Ch. 8 - Prob. 12RECh. 8 - Prob. 13RECh. 8 - Prob. 14RECh. 8 - Prob. 15RECh. 8 - Prob. 1WAICh. 8 - What does the P-value represent? Ch. 8 - Prob. 3WAICh. 8 - Prob. 4WAICh. 8 - Prob. 5WAICh. 8 - Prob. 1CSCh. 8 - Prob. 2CSCh. 8 - Prob. 3CSCh. 8 - Prob. 4CSCh. 8 - Prob. 5CSCh. 8 - Prob. 6CSCh. 8 - Prob. 7CS
Knowledge Booster
Background pattern image
Statistics
Learn more about
Need a deep-dive on the concept behind this application? Look no further. Learn more about this topic, statistics and related others by exploring similar questions and additional content below.
Recommended textbooks for you
  • Text book image
    Calculus For The Life Sciences
    Calculus
    ISBN:9780321964038
    Author:GREENWELL, Raymond N., RITCHEY, Nathan P., Lial, Margaret L.
    Publisher:Pearson Addison Wesley,
Text book image
Calculus For The Life Sciences
Calculus
ISBN:9780321964038
Author:GREENWELL, Raymond N., RITCHEY, Nathan P., Lial, Margaret L.
Publisher:Pearson Addison Wesley,
Mod-01 Lec-01 Discrete probability distributions (Part 1); Author: nptelhrd;https://www.youtube.com/watch?v=6x1pL9Yov1k;License: Standard YouTube License, CC-BY
Discrete Probability Distributions; Author: Learn Something;https://www.youtube.com/watch?v=m9U4UelWLFs;License: Standard YouTube License, CC-BY
Probability Distribution Functions (PMF, PDF, CDF); Author: zedstatistics;https://www.youtube.com/watch?v=YXLVjCKVP7U;License: Standard YouTube License, CC-BY
Discrete Distributions: Binomial, Poisson and Hypergeometric | Statistics for Data Science; Author: Dr. Bharatendra Rai;https://www.youtube.com/watch?v=lHhyy4JMigg;License: Standard Youtube License