
Concept explainers
Videos
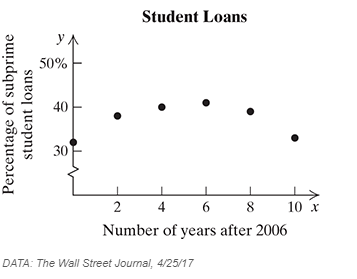
b Choosing Models. For the scatterplots and graphs in Exercises 19–26, determine which, if any, of the following functions might be used as a model for the data: Linear
Want to see the full answer?
Check out a sample textbook solution
Chapter 7 Solutions
Intermediate Algebra (13th Edition)


- In Exercises 41–48, write a piecewise formula for the function.arrow_forwardIn Exercises 17–27, use the vertex and intercepts to sketchthe graph of each quadratic function. Give the equation of the parabola’s axis of symmetry. Use the graph to determine the function’s domain and range. 17. f(x)=(x-4)2 -1 19. f(x)=(x-1)2 +2 21. y-1=(x-3)2 23. f(x)=2(x+2)2 -1 25. f(x)=4-(x-1)2 27. f(x)=x2 -2x-3arrow_forwardIn Exercises 39–44, an equation of a quadratic function is given. a. Determine, without graphing, whether the function has a minimum value or a maximum value. b. Find the minimum or maximum value and determine where it occurs. c. Identify the function's domain and its range. 39. f(x) = 3x – 12x – 1 41. f(x) = -4x² + &r – 3 43. f(x) = 5x? - 5x 40. f(x) = 2x? – &r – 3 42. f(x) = -2r² – 12x + 3 44. f(x) = 6x - 6x %3D %3D %3Darrow_forward
- The Mauna Loa Observatory in Hawaii records the carbon dioxide concentration y (in parts per million) in Earth’s atmosphere. The January readings for various years are shown in Figure . In the July 1990 issue of Scientific American, these data were used to predict the carbon dioxide level in Earth’s atmosphere in the year 2035, using the quadratic model y = 0.018t2 + 0.70t + 316.2 (Quadratic model for 1960–1990 data) where t = 0 represents 1960, as shown in Figure a. The data shown in figure b represent the years 1980 through 2014 and can be modeled by y = 0.014t2 + 0.66t + 320.3 (Quadratic model for 1980–2014) data where t = 0 represents 1960. What was the prediction given in the Scientific American article in 1990? Given the second model for 1980 through 2014, does this prediction for the year 2035 seem accurate?arrow_forwardUse this information to solve Exercises 9–11:A company is planning to produce and sell a new line of computers. The fixed cost will be $360,000 and it will cost $850 to produce each computer. Each computer will be sold for $1150. 9. Write the cost function, C, of producing x computers. 10. Write the revenue function, R, from the sale of x computers. 11. Determine the break-even point. Describe what this means.arrow_forwardSection 2.4: Chain Rule In Exercises 9–34, find the derivative of the function.arrow_forward
- exercise #3arrow_forwardIn Exercises 47–50, determine the x-intercepts of the graph of each quadratic function. Then match the function with its graph, labeled (a)-(d). Each graph is shown in a [-10, 10, 1] by [-10, 10, 1] viewing rectangle. 47. у 3D х2 -бх + 8 48. y = x? – 2r – 8 49. y = x² + 6x + 8 50. y = x² + 2x – 8 а. b. C. d.arrow_forwardWorld Military Expenditure The following chart shows total military and arms trade expenditure from 2011–2020 (t = 1 represents 2011). †A bar graph titled "World military expenditure" has a horizontal t-axis labeled "Year since 2010" and a vertical axis labeled "$ (billions)". The bar graph has 10 bars. Each bar is associated with a label and an approximate value as listed below. 1: 1,800 billion dollars 2: 1,775 billion dollars 3: 1,750 billion dollars 4: 1,730 billion dollars 5: 1,760 billion dollars 6: 1,760 billion dollars 7: 1,850 billion dollars 8: 1,900 billion dollars 9: 1,950 billion dollars 10: 1,980 billion dollars (a) If you want to model the expenditure figures with a function of the form f(t) = at2 + bt + c, would you expect the coefficient a to be positive or negative? Why? HINT [See "Features of a Parabola" in this section.] We would expect the coefficient to be positive because the curve is concave up. We would expect the coefficient to be negative because the…arrow_forward
 Algebra & Trigonometry with Analytic GeometryAlgebraISBN:9781133382119Author:SwokowskiPublisher:Cengage
 Calculus For The Life SciencesCalculusISBN:9780321964038Author:GREENWELL, Raymond N., RITCHEY, Nathan P., Lial, Margaret L.Publisher:Pearson Addison Wesley,