
Concept explainers
Videos
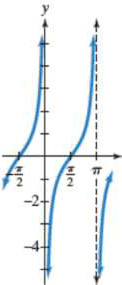
In Exercises 13-16, the graph of a cotangent function is given. Select the equation for each graph from the following options:
Want to see the full answer?
Check out a sample textbook solution
Chapter 5 Solutions
ALGEBRA+TRIGONOMETRY


- Label the y-axis temperature (℃). Have the y-axis go from -20℃ to 120℃ and have the intervals go by 5 ℃ like this: -20℃, -15℃, -10℃, -5℃, 0℃, 5℃ etc. Label the x-axis time (minutes). The time scale should run from 0.0 minutes to 25.0 minutes. Make the time intervals go by 1 like this: 0, 1, 2, 3, 4, 5 etc. Use the data in the table below to fill in the graph. You should have 26 dots on the graph. Connect the data points with a line for each section of the graph. The graph has five sections.arrow_forwardDetermine an equation that my Be represented by the grapharrow_forwardSketch the graph of y =arrow_forward
 Trigonometry (MindTap Course List)TrigonometryISBN:9781305652224Author:Charles P. McKeague, Mark D. TurnerPublisher:Cengage Learning
 Algebra & Trigonometry with Analytic GeometryAlgebraISBN:9781133382119Author:SwokowskiPublisher:Cengage
 Calculus For The Life SciencesCalculusISBN:9780321964038Author:GREENWELL, Raymond N., RITCHEY, Nathan P., Lial, Margaret L.Publisher:Pearson Addison Wesley,
 Mathematics For Machine TechnologyAdvanced MathISBN:9781337798310Author:Peterson, John.Publisher:Cengage Learning,
 Holt Mcdougal Larson Pre-algebra: Student Edition...AlgebraISBN:9780547587776Author:HOLT MCDOUGALPublisher:HOLT MCDOUGAL