Exploring Economics
Exploring Economics
8th Edition
ISBN: 9781544336329
Author: Robert L. Sexton
Publisher: SAGE Publications, Inc
Question
Book Icon
Chapter 5, Problem 10P
To determine

(a)

Refer to the given supply and demand graph

Exploring Economics, Chapter 5, Problem 10P , additional homework tip  1

Determine the shift or shifts in supply or demand could move the equilibrium price and quantity to each of points A through I

To determine

(b)

Refer to the given supply and demand graph:

Exploring Economics, Chapter 5, Problem 10P , additional homework tip  2

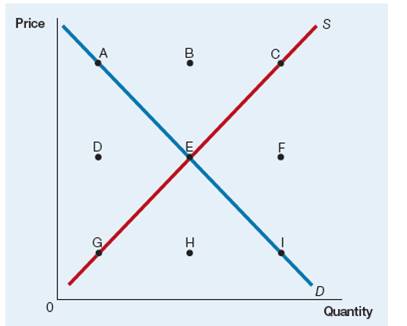
Determine the change in graph keeping E as the initial equilibrium point, if both the decrease in price of substitute in production and increase in income occurred, if it is a normal good

To determine

(c)

Refer to the given supply and demand graph:

Exploring Economics, Chapter 5, Problem 10P , additional homework tip  3

Determine change keeping E as the equilibrium point, if both an increase in price of an input and advance technology occurred.

To determine

(d)

Refer to the given supply and demand graph:

Exploring Economics, Chapter 5, Problem 10P , additional homework tip  4

Determine the point that would be quantity supplied and quantity demanded if the price floor is imposed above the equilibrium price also, show the new quantity exchanged.

To determine

(e)

Refer to the given supply and demand graph:

Exploring Economics, Chapter 5, Problem 10P , additional homework tip  5

Determine the point tend to be the quantity supplied and quantity demanded if price ceiling is imposed below the equilibrium price, also state the new quantity exchanged.,

Blurred answer
Students have asked these similar questions
Use supply and demand curves to illustrate how each of the following changes will affect the equilibrium price and quantity of the stated product, ceterus paribus.  Before you guess, answer the following questions:  (1) Which determinant has changed?  (2) Will it affect supply or demand?  (3) Will supply or demand increase or decrease?  (4) GRAPH IT! What happens to price and quantity?   1. The government provided subsidies for the farmers to improve their irrigation facilities. How would this improvement affect the equilibrium price and quantity of rice?   2. Wood furniture prices increase. How would this affect the equilibrium price and quantity of steel furniture?   3. During a recession, economies experience increased unemployment and a reduced level of activity. How would a recession be likely to affect the equilibrium price and quantity of new cars?   4. The government imposes a nationwide lockdown due to pandemic. How would this affect the market and equilibrium price of…
What effect will each of the following have on the supply of auto tires?  Microeconomics chapter 3  Supply is a schedule or curve showing the amounts of a productthat producers are willing to offer in the market at each possibleprice during a specific period. The law of supply states that otherthings equal, producers will offer more of a product at a high pricethan at a low price. Thus, the relationship between price and quantity supplied is positive or direct, and supply is graphed as anupsloping curve.The market supply curve is the horizontal summation of thesupply curves of the individual producers of the product.Changes in one or more of the determinants of supply (resource prices, production techniques, taxes or subsidies, the pricesof other goods, producer expectations, or the number of sellers inthe market) shift the supply curve of a product. A shift to the rightis an increase in supply; a shift to the left is a decrease in supply. Incontrast, a change in the price of the…
Knowledge Booster
Background pattern image
Recommended textbooks for you
Text book image
Exploring Economics
Economics
ISBN:9781544336329
Author:Robert L. Sexton
Publisher:SAGE Publications, Inc
Text book image
Economics Today and Tomorrow, Student Edition
Economics
ISBN:9780078747663
Author:McGraw-Hill
Publisher:Glencoe/McGraw-Hill School Pub Co
Text book image
ECON MACRO
Economics
ISBN:9781337000529
Author:William A. McEachern
Publisher:Cengage Learning
Text book image
Principles of Macroeconomics (MindTap Course List)
Economics
ISBN:9781305971509
Author:N. Gregory Mankiw
Publisher:Cengage Learning
Text book image
Brief Principles of Macroeconomics (MindTap Cours...
Economics
ISBN:9781337091985
Author:N. Gregory Mankiw
Publisher:Cengage Learning
Text book image
Essentials of Economics (MindTap Course List)
Economics
ISBN:9781337091992
Author:N. Gregory Mankiw
Publisher:Cengage Learning