Concept explainers
Explanation of Solution
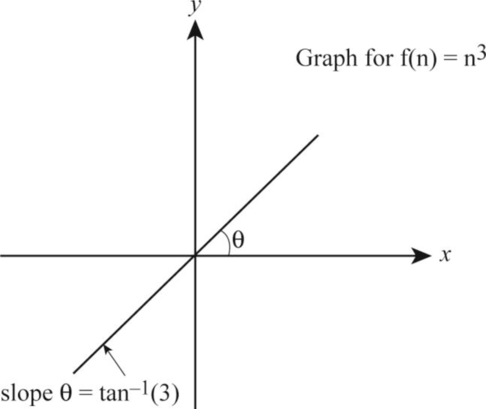
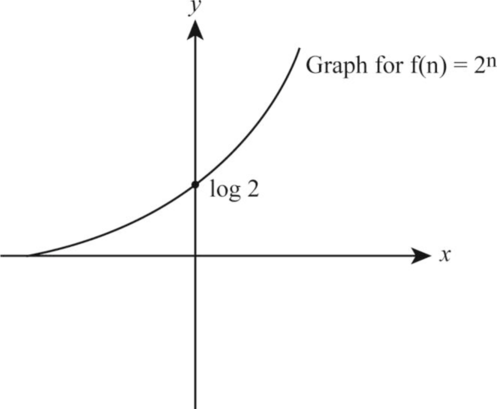
Graph of functions using logarithmic scale:
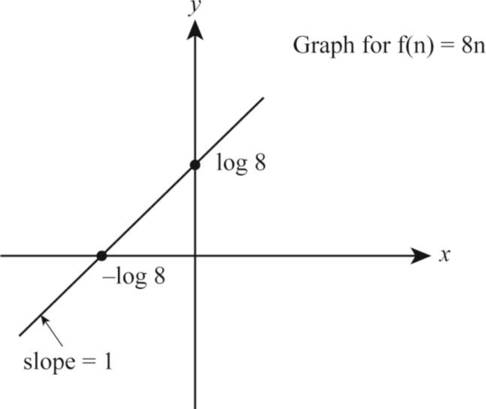
8n:
Let the function be:
Take the logarithm on both the sides of the above function as follows:
According to the given data, let us take
Thus, from the above Equation (2), the value of
The following is the graph representation corresponding to the values
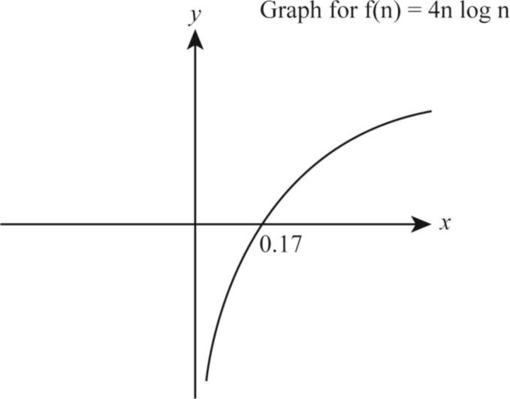
4n logn:
Let the function be:
Take the logarithm on both the sides of the above function as follows:
According to the given data, let us take
The following is the graph representation corresponding for the function
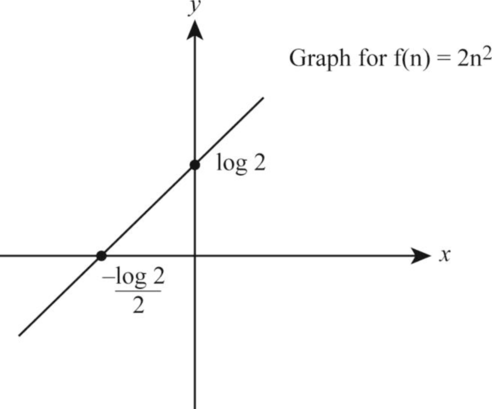
Let the function be:
Take the logarithm on both the sides of the above function as follows:
According to the given data, let us take
Thus, from the above Equation (6), the value of
The following is the graph representation corresponding to the values
Let the function be:
Take the logarithm on both the sides of the above function as follows:
According to the given data, let us take
The following is the graph representation corresponding to the value on respective x-axis and y-axis respectively.
Let the function be:
Take the logarithm on both the sides of the above function as follows:
According to the given data, let us take
The following is the graph representation corresponding to the value on respective x-axis and y-axis respectively.
Want to see more full solutions like this?
Chapter 4 Solutions
Data Structures and Algorithms in Java


- Let v be a vector whose coordinates are given as v = [vx, Vy, Vz. If the quaternion Q represents a rotation, show that the new, rotated coordinates of v are given by Q(0, Vx, Vy, Vz)Q*, where (0, vx, Vy, Vz) is a quaternion with zero as its real component.arrow_forwardRecall that the dot product of two vectors (1d matrices) produces a scalar value. The dot product is slightly confusing as the scalar value produced can have an arbitrary meaning that simply represents the mathematical operations of multiplying and summing. In other words, the dot product can simply represent the linear projection of vector onto the number line. This interpretation will be used repeatedly throughout machine learning as our main goal will be to take some features dotted with some weights/parameters. Once again, this can be though of as projecting our features onto a number line where the projection acts as our prediction! Keep this idea in mind as it might not make complete sense as of yet. It also important to know that the dot product can additionally take on other meanings such as a geometric meaning which represents how similar any two vectors are when projected onto one another. Meaning, how much one vector points in the direction of another. Given the following…arrow_forwardThis is discrete math: Find f ? g and g ? f , where f (x) = x^2 + 1 and g(x) = x + 2, are functions from R to Rarrow_forward
- Simplify the following function using Karnaugh Map?arrow_forwardUse the Random number generator to fill a two-dimensional (2D) histogram by using a two gaussian with a mean and standard deviation of 20 and 2 respectively. Draw the histogram, with surf1 and colz options. In root.arrow_forwardLet T(n) be a function obeying the recurrence T(n)=5T(n/5) + n°, then T(n)= a. none b. \(\theta(n) \) c. \(\theta(n) \) 3. 1. \(logn \theta(n) \)arrow_forward
- Implement the function F(A, B, C, D) = Em(1, 2, 5, 7, 9, 14) using MUX. %3Darrow_forwardRepresent the GCDs calculated in Problem 2 as a linear combination of the original numbers. (i.e., GCD (a, b) = s*a + t* b, where s and t could be found using Bezout’s Theorem).arrow_forwardCreate K-maps and then simplify for the following functions 1) F(x, y, z) = xyz’ + x’yz + xyzarrow_forward
- An oscillating current in an electric circuit is described by i(t) = 9e cos(2rt) where t is in seconds. Use False Position Method to determine the value of t such that i=3.5. Plot the graph of the function to develop your initial guess. Terminate your computation when the approximate relative error falls below ɛs=10°. Give the results in a table.arrow_forwardGive regular expressions for the i (a) {w : w contains at most two 1s} (b) {w : w contains at least two 1s} (c) {w: every odd position in w is 1} (d) {w : w contains an even number of 0s, orarrow_forwardPlease use Octave or Matlab - I use Octave so that is preferable Gauss Seidel function file: function xnew=gauss_seidel(A,b,xold) n=size(A)(1); At=A;xnew=xold; for k=1:n At(k,k)=0; endfor k=1:n xnew(k)=(b(k)-At(k,:)*xnew)/A(k,k); end endfunctionarrow_forward
 Database System ConceptsComputer ScienceISBN:9780078022159Author:Abraham Silberschatz Professor, Henry F. Korth, S. SudarshanPublisher:McGraw-Hill Education
 Starting Out with Python (4th Edition)Computer ScienceISBN:9780134444321Author:Tony GaddisPublisher:PEARSON
 Digital Fundamentals (11th Edition)Computer ScienceISBN:9780132737968Author:Thomas L. FloydPublisher:PEARSON
 C How to Program (8th Edition)Computer ScienceISBN:9780133976892Author:Paul J. Deitel, Harvey DeitelPublisher:PEARSON
 Database Systems: Design, Implementation, & Manag...Computer ScienceISBN:9781337627900Author:Carlos Coronel, Steven MorrisPublisher:Cengage Learning
 Programmable Logic ControllersComputer ScienceISBN:9780073373843Author:Frank D. PetruzellaPublisher:McGraw-Hill Education