
Videos
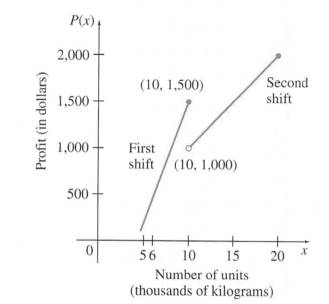
Production The graph shows the profit from the daily production of
a.
b.
c.
d.
e. Where is the function discontinuous? What might account for such a discontinuity?
f. Use the graph to estimate the number of units of the chemical that must be produced before the second shift is as profitable as first.
Want to see the full answer?
Check out a sample textbook solution
Chapter 3 Solutions
Calculus For The Life Sciences


 Algebra & Trigonometry with Analytic GeometryAlgebraISBN:9781133382119Author:SwokowskiPublisher:Cengage