
Cornerstones of Cost Management (Cornerstones Series)
4th Edition
ISBN: 9781305970663
Author: Don R. Hansen, Maryanne M. Mowen
Publisher: Cengage Learning
expand_more
expand_more
format_list_bulleted
Concept explainers
Videos
Textbook Question
Chapter 3, Problem 33P
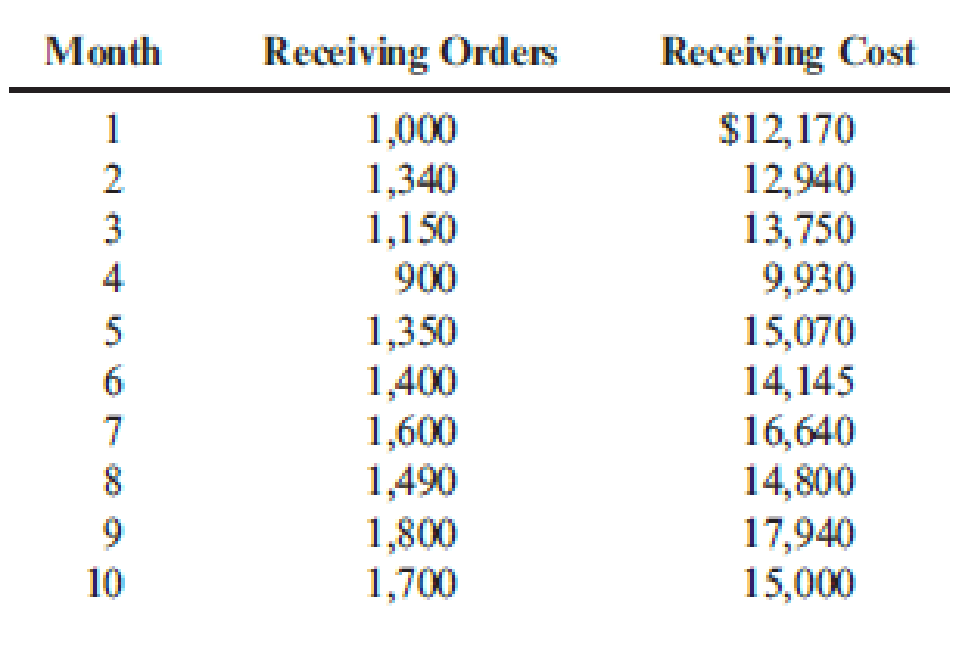
Big Mike’s, a large hardware store, has gathered data on its
Required:
- 1. Prepare a scattergraph, plotting the receiving costs against the number of purchase orders. Use the vertical axis for costs and the horizontal axis for orders.
- 2. Select two points that make the best fit, and compute a cost formula for receiving costs.
- 3. Using the high-low method, prepare a cost formula for the receiving activity.
- 4. Using the method of least squares, prepare a cost formula for the receiving activity. What is the coefficient of determination?
Expert Solution & Answer

Trending nowThis is a popular solution!

Chapter 3 Solutions
Cornerstones of Cost Management (Cornerstones Series)
Ch. 3 - Why is knowledge of cost behavior important for...Ch. 3 - How does the length of the time horizon affect the...Ch. 3 - Prob. 3DQCh. 3 - What is the relationship between flexible...Ch. 3 - What is the relationship between committed...Ch. 3 - Describe the difference between a variable cost...Ch. 3 - Why do mixed costs pose a problem when it comes to...Ch. 3 - Why is a scattergraph a good first step in...Ch. 3 - What are the advantages of the scatterplot method...Ch. 3 - Prob. 10DQ
Ch. 3 - What is meant by the best-fitting line? Is the...Ch. 3 - When is multiple regression required to explain...Ch. 3 - Explain the meaning of the learning curve. How do...Ch. 3 - Assume you are the manager responsible for...Ch. 3 - Some firms assign mixed costs to either the fixed...Ch. 3 - Callies Gym is a complete fitness center. Owner...Ch. 3 - Corazon Manufacturing Company has a purchasing...Ch. 3 - Darnell Poston, owner of Poston Manufacturing,...Ch. 3 - Dohini Manufacturing Company had the following 12...Ch. 3 - Refer to Cornerstone Exercise 3.4 for data on...Ch. 3 - The controller for Dohini Manufacturing Company...Ch. 3 - Prob. 7CECh. 3 - State Universitys football team just received a...Ch. 3 - Classify the following costs of activity inputs as...Ch. 3 - SmokeCity, Inc., manufactures barbeque smokers....Ch. 3 - Cashion Company produces chemical mixtures for...Ch. 3 - For the following activities and their associated...Ch. 3 - Prob. 13ECh. 3 - Vargas, Inc., produces industrial machinery....Ch. 3 - Penny Davis runs the Shear Beauty Salon near a...Ch. 3 - Shirrell Blackthorn is the accountant for several...Ch. 3 - Deepa Dalal opened a free-standing radiology...Ch. 3 - Prob. 18ECh. 3 - The controller of the South Charleston plant of...Ch. 3 - Lassiter Company used the method of least squares...Ch. 3 - Sweet Dreams Bakery was started five years ago by...Ch. 3 - Ginnian and Fitch, a regional accounting firm,...Ch. 3 - Bordner Company manufactures HVAC (heating,...Ch. 3 - Sharon Glessing, controller for Janson Company,...Ch. 3 - The graphs below represent cost behavior patterns...Ch. 3 - Starling Co. manufactures one product with a...Ch. 3 - Alard Manufacturing Company has a billing...Ch. 3 - Prob. 28ECh. 3 - Prob. 29ECh. 3 - Natur-Gro, Inc., manufactures composters. Based on...Ch. 3 - Rolertyme Company manufactures roller skates. With...Ch. 3 - St. Teresas Medical Center (STMC) offers a number...Ch. 3 - Big Mikes, a large hardware store, has gathered...Ch. 3 - Kimball Company has developed the following cost...Ch. 3 - The management of Wheeler Company has decided to...Ch. 3 - DeMarco Company is developing a cost formula for...Ch. 3 - Weber Valley Regional Hospital has collected data...Ch. 3 - Friendly Bank is attempting to determine the cost...Ch. 3 - Randy Harris, controller, has been given the...Ch. 3 - The Lockit Company manufactures door knobs for...Ch. 3 - Harriman Industries manufactures engines for the...Ch. 3 - Thames Assurance Company sells a variety of life...
Knowledge Booster


Learn more about
Need a deep-dive on the concept behind this application? Look no further. Learn more about this topic, accounting and related others by exploring similar questions and additional content below.Similar questions
- Mott Company recently implemented a JIT manufacturing system. After one year of operation, Heidi Burrows, president of the company, wanted to compare product cost under the JIT system with product cost under the old system. Motts two products are weed eaters and lawn edgers. The unit prime costs under the old system are as follows: Under the old manufacturing system, the company operated three service centers and two production departments. Overhead was applied using departmental overhead rates. The direct overhead costs associated with each department for the year preceding the installation of JIT are as follows: Under the old system, the overhead costs of the service departments were allocated directly to the producing departments and then to the products passing through them. (Both products passed through each producing department.) The overhead rate for the Machining Department was based on machine hours, and the overhead rate for assembly was based on direct labor hours. During the last year of operations for the old system, the Machining Department used 80,000 machine hours, and the Assembly Department used 20,000 direct labor hours. Each weed eater required 1.0 machine hour in Machining and 0.25 direct labor hour in Assembly. Each lawn edger required 2.0 machine hours in Machining and 0.5 hour in Assembly. Bases for allocation of the service costs are as follows: Upon implementing JIT, a manufacturing cell for each product was created to replace the departmental structure. Each cell occupied 40,000 square feet. Maintenance and materials handling were both decentralized to the cell level. Essentially, cell workers were trained to operate the machines in each cell, assemble the components, maintain the machines, and move the partially completed units from one point to the next within the cell. During the first year of the JIT system, the company produced and sold 20,000 weed eaters and 30,000 lawn edgers. This output was identical to that for the last year of operations under the old system. The following costs have been assigned to the manufacturing cells: Required: 1. Compute the unit cost for each product under the old manufacturing system. 2. Compute the unit cost for each product under the JIT system. 3. Which of the unit costs is more accurate? Explain. Include in your explanation a discussion of how the computational approaches differ. 4. Calculate the decrease in overhead costs under JIT, and provide some possible reasons that explain the decrease.arrow_forwardEvans, Inc., has a unit-based costing system. Evanss Miami plant produces 10 different electronic products. The demand for each product is about the same. Although they differ in complexity, each product uses about the same labor time and materials. The plant has used direct labor hours for years to assign overhead to products. To help design engineers understand the assumed cost relationships, the Cost Accounting Department developed the following cost equation. (The equation describes the relationship between total manufacturing costs and direct labor hours; the equation is supported by a coefficient of determination of 60 percent.) Y=5,000,000+30X,whereX=directlaborhours The variable rate of 30 is broken down as follows: Because of competitive pressures, product engineering was given the charge to redesign products to reduce the total cost of manufacturing. Using the above cost relationships, product engineering adopted the strategy of redesigning to reduce direct labor content. As each design was completed, an engineering change order was cut, triggering a series of events such as design approval, vendor selection, bill of materials update, redrawing of schematic, test runs, changes in setup procedures, development of new inspection procedures, and so on. After one year of design changes, the normal volume of direct labor was reduced from 250,000 hours to 200,000 hours, with the same number of products being produced. Although each product differs in its labor content, the redesign efforts reduced the labor content for all products. On average, the labor content per unit of product dropped from 1.25 hours per unit to one hour per unit. Fixed overhead, however, increased from 5,000,000 to 6,600,000 per year. Suppose that a consultant was hired to explain the increase in fixed overhead costs. The consultants study revealed that the 30 per hour rate captured the unit-level variable costs; however, the cost behavior of other activities was quite different. For example, setting up equipment is a step-fixed cost, where each step is 2,000 setup hours, costing 90,000. The study also revealed that the cost of receiving goods is a function of the number of different components. This activity has a variable cost of 2,000 per component type and a fixed cost that follows a step-cost pattern. The step is defined by 20 components with a cost of 50,000 per step. Assume also that the consultant indicated that the design adopted by the engineers increased the demand for setups from 20,000 setup hours to 40,000 setup hours and the number of different components from 100 to 250. The demand for other non-unit-level activities remained unchanged. The consultant also recommended that management take a look at a rejected design for its products. This rejected design increased direct labor content from 250,000 hours to 260,000 hours, decreased the demand for setups from 20,000 hours to 10,000 hours, and decreased the demand for purchasing from 100 component types to 75 component types, while the demand for all other activities remained unchanged. Required: 1. Using normal volume, compute the manufacturing cost per labor hour before the year of design changes. What is the cost per unit of an average product? 2. Using normal volume after the one year of design changes, compute the manufacturing cost per hour. What is the cost per unit of an average product? 3. Before considering the consultants study, what do you think is the most likely explanation for the failure of the design changes to reduce manufacturing costs? Now use the information from the consultants study to explain the increase in the average cost per unit of product. What changes would you suggest to improve Evanss efforts to reduce costs? 4. Explain why the consultant recommended a second look at a rejected design. Provide computational support. What does this tell you about the strategic importance of cost management?arrow_forwardAntolini Enterprises produces mens sports coats that are sold by popular department stores. Each retail order is treated as a job that accumulates materials, labor, and overhead costs for a batch of sports coats. Management has obtained data on the labor costs for four selected jobs over a six-month period. Each selected job represents a similar style and size of sports coat. The data are as follows: a. Determine the direct labor cost per unit for each job. b. Interpret the trend in per-unit labor cost. c. Determine the direct labor hours per sports coat. d. Interpret what may be happening with Job 192.arrow_forward
- John Sheng, a cost accountant at Starlet Company, is developing departmental factory overhead application rates for the companys Tooling and Fabricating departments. The budgeted overhead for each department and the data for one job are as follows: Using the departmental overhead application rates, total overhead applied to Job 231 in the Tooling and Fabricating departments will be: a. 225. b. 303. c. 537. d. 671.arrow_forwardFirenza Company manufactures specialty tools to customer order. Budgeted overhead for the coming year is: Previously, Sanjay Bhatt, Firenza Companys controller, had applied overhead on the basis of machine hours. Expected machine hours for the coming year are 50,000. Sanjay has been reading about activity-based costing, and he wonders whether or not it might offer some advantages to his company. He decided that appropriate drivers for overhead activities are purchase orders for purchasing, number of setups for setup cost, engineering hours for engineering cost, and machine hours for other. Budgeted amounts for these drivers are 5,000 purchase orders, 500 setups, and 2,500 engineering hours. Sanjay has been asked to prepare bids for two jobs with the following information: The typical bid price includes a 40 percent markup over full manufacturing cost. Required: 1. Calculate a plantwide rate for Firenza Company based on machine hours. What is the bid price of each job using this rate? 2. Calculate activity rates for the four overhead activities. What is the bid price of each job using these rates? 3. Which bids are more accurate? Why?arrow_forwardLansing. Inc., provided the following data for its two producing departments: Machine hours are used to assign the overhead of the Molding Department, and direct labor hours are used to assign the overhead of the Polishing Department. There are 30,000 units of Form A produced and sold and 50,000 of Form B. Required: 1. Calculate the overhead rates for each department. 2. Using departmental rates, assign overhead to live two products and calculate the overhead cost per unit. How does this compare with the plantwide rate unit cost, using direct labor hours? 3. What if the machine hours in Molding were 1,200 for Form A and 3,800 for Form B and the direct labor hours used in Polishing were 5,000 and 15,000, respectively? Calculate the overhead cost per unit for each product using departmental rates, and compare with the plantwide rate unit costs calculated in Requirement 2. What can you conclude from this outcome?arrow_forward
- The controller for Muir Companys Salem plant is analyzing overhead in order to determine appropriate drivers for use in flexible budgeting. She decided to concentrate on the past 12 months since that time period was one in which there was little important change in technology, product lines, and so on. Data on overhead costs, number of machine hours, number of setups, and number of purchase orders are in the following table. Required: 1. Calculate an overhead rate based on machine hours using the total overhead cost and total machine hours. (Round the overhead rate to the nearest cent and predicted overhead to the nearest dollar.) Use this rate to predict overhead for each of the 12 months. 2. Run a regression equation using only machine hours as the independent variable. Prepare a flexible budget for overhead for the 12 months using the results of this regression equation. (Round the intercept and x-coefficient to the nearest cent and predicted overhead to the nearest dollar.) Is this flexible budget better than the budget in Requirement 1? Why or why not?arrow_forwardThayne Company has 30 clerks that work in its Accounts Payable Department. A study revealed the following activities and the relative time demanded by each activity: Required: Classify the four activities as value-added or non-value-added, and calculate the clerical cost of each activity. For non-value-added activities, indicate why they are non-value-added.arrow_forwardAnderson Company has the following departmental manufacturing structure for one of its products: After some study, the production manager of Anderson recommended the following revised cellular manufacturing approach: Required: 1. Calculate the total time it takes to produce a batch of 20 units using Andersons traditional departmental structure. 2. Using cellular manufacturing, how much time is saved producing the same batch of 20 units? Assuming the cell operates continuously, what is the production rate? Which process controls this production rate? 3. What if the processing times of molding, welding, and assembly are all reduced to six minutes each? What is the production rate now, and how long will it take to produce a batch of 20 units?arrow_forward
- Randy Harris, controller, has been given the charge to implement an advanced cost management system. As part of this process, he needs to identify activity drivers for the activities of the firm. During the past four months, Randy has spent considerable effort identifying activities, their associated costs, and possible drivers for the activities costs. Initially, Randy made his selections based on his own judgment using his experience and input from employees who perform the activities. Later, he used regression analysis to confirm his judgment. Randy prefers to use one driver per activity, provided that an R2 of at least 80 percent can be produced. Otherwise, multiple drivers will be used, based on evidence provided by multiple regression analysis. For example, the activity of inspecting finished goods produced an R2 of less than 80 percent for any single activity driver. Randy believes, however, that a satisfactory cost formula can be developed using two activity drivers: the number of batches and the number of inspection hours. Data collected for a 14-month period are as follows: Required: 1. Calculate the cost formula for inspection costs using the two drivers, inspection hours and number of batches. Are both activity drivers useful? What does the R2 indicate about the formula? 2. Using the formula developed in Requirement 1, calculate the inspection cost when 300 inspection hours are used and 30 batches are produced. Prepare a 90 percent confidence interval for this prediction.arrow_forwardCalen Company manufactures and sells three products in a factory of three departments. Both labor and machine time are applied to the products as they pass through each department. The nature of the machine processing and of the labor skills required in each department is such that neither machines nor labor can be switched from one department to another. Calens management is attempting to plan its production schedule for the next several months. The planning is complicated by the fact that labor shortages exist in the community and some machines will be down several months for repairs. Following is information regarding available machine and labor time by department and the machine hours and direct labor hours required per unit of product. These data should be valid for at least the next six months. Calen believes that the monthly demand for the next six months will be as follows: Inventory levels will not be increased or decreased during the next six months. The unit cost and price data for each product are as follows: Required: 1. Calculate the monthly requirement for machine hours and direct labor hours for producing Products 401, 402, and 403 to determine whether or not the factory can meet the monthly sales demand. 2. Determine the quantities of 401, 402, and 403 that should be produced monthly to maximize profits. Prepare a schedule that shows the contribution to profits of your product mix. 3. Assume that the machine hours available in Department 3 are 1,500 instead of 2,700. Calculate the optimal monthly product mix using the graphing approach to linear programming. Prepare a schedule that shows the contribution to profits from this optimal mix. (CMA adapted)arrow_forwardThe following describes the job responsibilities of two employees of Barney Manufacturing. Joan Dennison, Cost Accounting Manager. Joan is responsible for measuring and collecting costs associated with the manufacture of the garden hose product line. She is also responsible for preparing periodic reports that compare the actual costs with planned costs. These reports are provided to the production line managers and the plant manager. Joan helps to explain and interpret the reports. Steven Swasey, Production Manager. Steven is responsible for the manufacture of the high-quality garden hose. He supervises the line workers, helps to develop the production schedule, and is responsible for seeing that production quotas are met. He is also held accountable for controlling manufacturing costs. Required: CONCEPTUAL CONNECTION Identify Joan and Steven as line or staff and explain your reasons.arrow_forward
arrow_back_ios
SEE MORE QUESTIONS
arrow_forward_ios
Recommended textbooks for you
 Cornerstones of Cost Management (Cornerstones Ser...AccountingISBN:9781305970663Author:Don R. Hansen, Maryanne M. MowenPublisher:Cengage Learning
 Excel Applications for Accounting PrinciplesAccountingISBN:9781111581565Author:Gaylord N. SmithPublisher:Cengage Learning
 Financial And Managerial AccountingAccountingISBN:9781337902663Author:WARREN, Carl S.Publisher:Cengage Learning,
 Managerial AccountingAccountingISBN:9781337912020Author:Carl Warren, Ph.d. Cma William B. TaylerPublisher:South-Western College Pub
 Principles of Cost AccountingAccountingISBN:9781305087408Author:Edward J. Vanderbeck, Maria R. MitchellPublisher:Cengage Learning
 Managerial Accounting: The Cornerstone of Busines...AccountingISBN:9781337115773Author:Maryanne M. Mowen, Don R. Hansen, Dan L. HeitgerPublisher:Cengage Learning
Cornerstones of Cost Management (Cornerstones Ser...
Accounting
ISBN:9781305970663
Author:Don R. Hansen, Maryanne M. Mowen
Publisher:Cengage Learning
Excel Applications for Accounting Principles
Accounting
ISBN:9781111581565
Author:Gaylord N. Smith
Publisher:Cengage Learning
Financial And Managerial Accounting
Accounting
ISBN:9781337902663
Author:WARREN, Carl S.
Publisher:Cengage Learning,
Managerial Accounting
Accounting
ISBN:9781337912020
Author:Carl Warren, Ph.d. Cma William B. Tayler
Publisher:South-Western College Pub
Principles of Cost Accounting
Accounting
ISBN:9781305087408
Author:Edward J. Vanderbeck, Maria R. Mitchell
Publisher:Cengage Learning
Managerial Accounting: The Cornerstone of Busines...
Accounting
ISBN:9781337115773
Author:Maryanne M. Mowen, Don R. Hansen, Dan L. Heitger
Publisher:Cengage Learning
Cost Classifications - Managerial Accounting- Fixed Costs Variable Costs Direct & Indirect Costs; Author: Accounting Instruction, Help, & How To;https://www.youtube.com/watch?v=QQd1_gEF1yM;License: Standard Youtube License