
Concept explainers
Videos
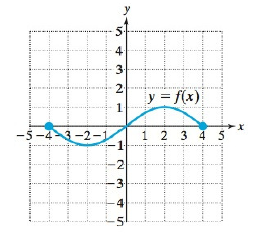
To Graph: The graph of the function
Explanation of Solution
Given: The function
Graph:
The graph of
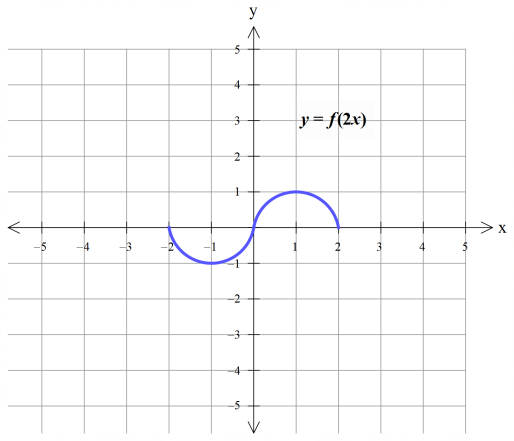
Apply the horizontal compress (divide
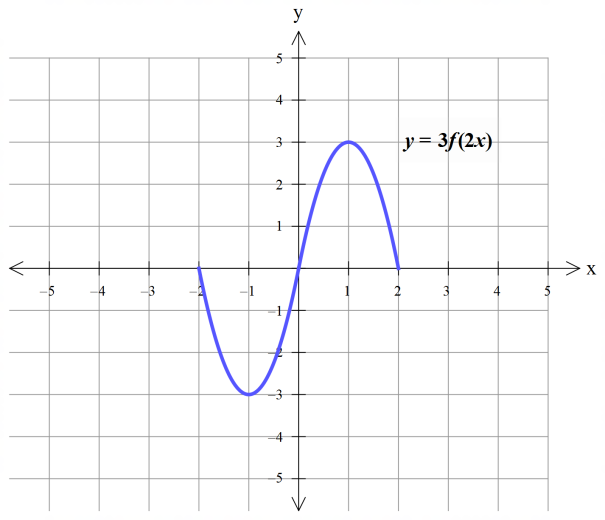
Apply the vertical stretch (multiply the
Reflect the graph across
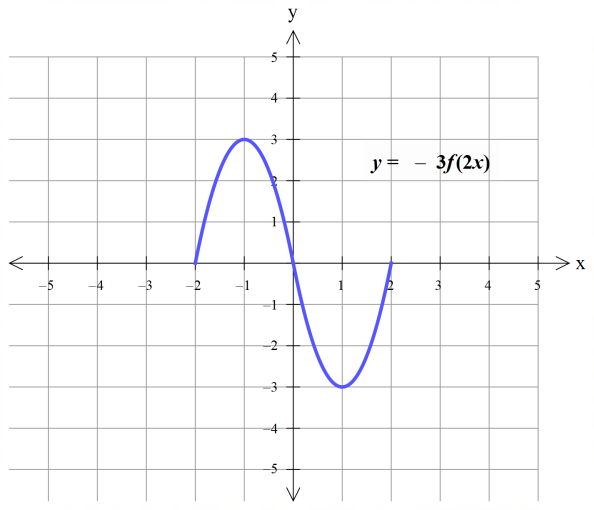
After the above transformations, the graph is drawn as shown above in the final step.
Interpretation:
The graphs of
Want to see more full solutions like this?
Chapter 2 Solutions
College Algebra Essentials


- Marriage Rate The marriage rate per 1000 unmarried women for the years 1987–2014 is given by 132x + 1000y = 9570 where x is the number ofyears after 1980.a. Find the x-intercept of the graph of this function. b. Find and interpret the y-intercept of the graph ofthis function.c. Graph this function, using the intercepts.(Source: National Vital Statistics Report)arrow_forwardFor each graph in Exercises 61–72, find a function whosegraph looks like the one shown. When you are finished, usea graphing utility to check that your function f has the properties and features of the given graph.arrow_forward. Marriage Rate The marriage rate per 1000 unmarriedwomen for the years 1987–2014 can be modeled bythe function 132x + 1000y = 9570, where x is thenumber of years after 1980. During what year doesthe equation indicate the marriage rate will be 4.29?(Source: National Vital Statistics Report 2010)arrow_forward
- Write a function to model the scenario [y=a (x-h)2 + k]arrow_forwardIn Exercises 37–40, use the vertical line test (see Exercise 35) to determine whether the curve is the graph of a function.arrow_forwardThe diagram below shows the graph of the function y =-x +9. Point C (0, c) lies on the curve. Find the value of c- q.arrow_forward
- Retail Sales November and December retail sales,excluding autos, for the years 2001–2010 can be modeled by the function S(x) = -1.751x2 + 38.167x +388.997 billion dollars, where x is the number ofyears after 2000.a. Graph the function for values of x representing2001–2010.b. During what years does the model estimate thesales to be $550 billion?c. The recession in 2008 caused retail sales to drop.Does the model agree with the facts; that is, doesit indicate that a maximum occurred in 2008?arrow_forwardIn Exercises 1–4, graph the function. State its domain and range.arrow_forwardSketch the graph of the function y = |x? - 25|.arrow_forward
- For Exercises 9–18, graph the functions by plotting points or by using a graphing utility. Explain how the graphs are related. 9. a. f(x) = x b. g(x) = x + 2 c. h(x) = x² – 4 13. a. f(x) = |x| b. g(x) = -|x| 16. a. f(x) = |x| 1 b. g(x) = x| 14. a. f(x) = Vĩ b. g(x) = - Vĩ c. h(x) = 3|x| 10. a. f(x) = |x| b. g(x) = |x|+ 2 c. h(x) = |x| – 4 17. a. f(x) = V b. g(x) = V-x 15. a. f(x) = ? %3D b. g(x) = 11. a. f(x) = Vx b. g(x) = Vx – 2 c. h(x) = Vx + 4 18. a. f(x) = VI b. g(x) = V-x c. h(x) = 2r 12. a. f(x) = x b. g(x) = (x – 2)? c. h(x) = (x + 3)?arrow_forwardGraph the functions in Exercises 25–28.arrow_forwardIn Exercises 65–70, use the graph of f to find each indicated function value. y = f(x) 65. f(-2) 66. f(2) -5 -4--2 2 4 5 67. f(4) 68. f(-4) 69. f(-3) 70. f(-1)arrow_forward
 Algebra & Trigonometry with Analytic GeometryAlgebraISBN:9781133382119Author:SwokowskiPublisher:Cengage