Concept explainers
Videos
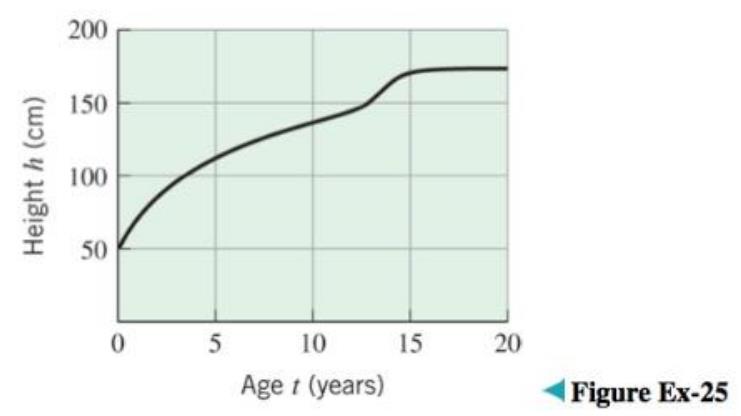
The accompanying figure shows the graph of the height
(a) When is the growth rate greatest?
(b) Estimate the growth rate at age
(c) At approximately what age between
(d) Draw a rough graph of the growth rate versus age.
Want to see the full answer?
Check out a sample textbook solution
Chapter 2 Solutions
Calculus Early Transcendentals, Binder Ready Version
Additional Math Textbook Solutions
Calculus, Single Variable: Early Transcendentals (3rd Edition)
Precalculus Enhanced with Graphing Utilities (7th Edition)
Precalculus: Mathematics for Calculus - 6th Edition
Precalculus: Concepts Through Functions, A Unit Circle Approach to Trigonometry (4th Edition)


- Exponential Growth Is the graph of exponential growth versus time increasing or decreasing?arrow_forwardTable 2 shows a recent graduate’s credit card balance each month after graduation. a. Use exponential regression to fit a model to these data. b. If spending continues at this rate, what will the graduate’s credit card debt be one year after graduating?arrow_forwardThe US. import of wine (in hectoliters) for several years is given in Table 5. Determine whether the trend appearslinear. Ifso, and assuming the trend continues, in what year will imports exceed 12,000 hectoliters?arrow_forward
- Maria, a biologist is observing the growth pattern of a virus. She starts with 100 of the virus that grows at a rate of 10% per hour. She will check on the virus in 24 hours. How many viruses will she find?arrow_forwardA driver of a car stopped at a gas station to fill up his gas tank. He looked at his watch, and the time read exactly 3:40 p.m. At this time, he started pumping gas into the tank. At exactly 3:44, the tank was full and he noticed that he had pumped 10.7 gallons. What is the average rate of flow of the gasoline into the gas tank?arrow_forwardThe half-life of plutonium-244 is 80,000,000 years. Find function gives the amount of carbon-14 remaining as a function of time, measured in years.arrow_forward
- Can the average rate of change of a function be constant?arrow_forwardDoes a linear, exponential, or logarithmic model best fit the data in Table 2? Find the model.arrow_forwardWhat is the y -intercept of the logistic growth model y=c1+aerx ? Show the steps for calculation. What does this point tell us about the population?arrow_forward
- Cancer Insulation workers who were exposed to asbestos and employed before 1960 experienced an increased likelihood of lung cancer. If a group of insulation workers has a cumulative total of 100,000 years of work experience with their first date of employment t years ago, then the number of lung cancer causes occuring within the group can be modeled using the function Nt=0.00437t3.2. Find the rate of growth of the number of workers with lung cancer in a group as described by the following first dates of employment. Source: Observation and Inference: An Introduction to the Methods of Epidemiology. a. 5 years ago b. 10 years agoarrow_forwardTable 6 shows the population, in thousands, of harbor seals in the Wadden Sea over the years 1997 to 2012. a. Let x represent time in years starting with x=0 for the year 1997. Let y represent the number of seals in thousands. Use logistic regression to fit a model to these data. b. Use the model to predict the seal population for the year 2020. c. To the nearest whole number, what is the limiting value of this model?arrow_forwardUse the table of values you made in part 4 of the example to find the limiting value of the average rate of change in velocity.arrow_forward


 Calculus For The Life SciencesCalculusISBN:9780321964038Author:GREENWELL, Raymond N., RITCHEY, Nathan P., Lial, Margaret L.Publisher:Pearson Addison Wesley,
 Algebra & Trigonometry with Analytic GeometryAlgebraISBN:9781133382119Author:SwokowskiPublisher:Cengage
 Glencoe Algebra 1, Student Edition, 9780079039897...AlgebraISBN:9780079039897Author:CarterPublisher:McGraw Hill
 Functions and Change: A Modeling Approach to Coll...AlgebraISBN:9781337111348Author:Bruce Crauder, Benny Evans, Alan NoellPublisher:Cengage Learning