
Videos
Compute the price relatives for the four stocks making up the Boran index in exercise 20. Use the weighted aggregates of price relatives to compute the January 2011 and March 2011 Boran indexes.
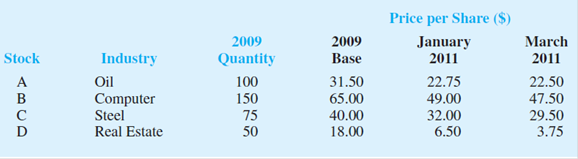
20. Boran Stockbrokers, Inc., selects four stocks for the purpose of developing its own index of stock market behavior. Prices per share for a 2009 base period, January 2011, and March 2011 follow. Base-year quantities are set on the basis of historical volumes for the four stocks.
Use the 2009 base period to compute the Boran index for January 2011 and March 2011. Comment on what the index tells you about what is happening in the stock market.
Find the price relatives for the four stocks making up the Boran index in Exercise 20.
Find the January 2011 and March 2011 Boran indexes by using the weighted aggregates of price relatives.
Answer to Problem 21SE
The price relatives for the four stocks for January 2011 are obtained below:
| Year | 2009 Base | January 2011 | |
| Oil | 31.50 | 22.75 | 72.2 |
| Computer | 65 | 49 | 75.4 |
| Steel | 40 | 32 | 80 |
| Real Estate | 18 | 6.50 | 36.1 |
The price relatives for the four stocks for March 2011 is obtained below:
| Year |
2009 Base | March 2011 | |
| Oil | 31.50 | 22.50 | 71.4 |
| Computer | 65 | 47.50 | 73.1 |
| Steel | 40 | 29.50 | 73.8 |
| Real Estate | 18 | 3.75 | 20.8 |
The Boran index for January 2011 by using the weighted aggregates of price relatives is 73.5.
The Boran index for March 2011 by using the weighted aggregates of price relatives is 70.10.
Explanation of Solution
Calculation:
The data represents the price per share for the periods January 2011, March 2011 and 2009 Base. Furthermore, the values of 2009 Quantity are also given.
The price relatives for the four stocks for January 2011 are obtained below:
| Year | 2009 Base | January 2011 | |
| Oil | 31.50 | 22.75 | |
| Computer | 65 | 49 | |
| Steel | 40 | 32 | |
| Real Estate | 18 | 6.50 |
The price relatives for the four stocks for March 2011 is obtained below:
| Year |
2009 Base | March 2011 | |
| Oil | 31.50 | 22.50 | |
| Computer | 65 | 47.50 | |
| Steel | 40 | 29.50 | |
| Real Estate | 18 | 3.75 |
The Boran index for January 2011 and March 2011 by using the weighted aggregates of price relatives is obtained below:
Thus, the Boran index for January 2011 by using the weighted aggregates of price relatives is 73.5.
The Boran index for March 2011 by using the weighted aggregates of price relatives is obtained below:
Thus, the Boran index for March 2011 by using the weighted aggregates of price relatives is 70.10.
Want to see more full solutions like this?
Chapter 20 Solutions
Statistics for Business & Economics, Revised (MindTap Course List)


- The Paasche method uses the amounts consumed in the base period, qo, as weights to determine a price index. True or False True Falsearrow_forwardThe following table gives the prices of some food items in the base year and current year and the quantities sold in the base year and current year. Commodity 2000 2005 Price (K) Quantity Price (K) Quantity A 15 15 22 12 B 20 5 27 4 C 4 10 7 5 Compute the following price index numbers for 2005 from the above table: Laspeyre’s price index number Paasche’s price index numberarrow_forwardThe selling prices of mutual funds change daily. In order to study these changes, a sample of mutual funds was examined and the daily changes in price are listed below. (Round answers to 3 decimal places) 0.32, -0.17, 0.26, -0.03, -0.01, 0.18, 0.33, 0.28, 0.02, -0.29, -0.08, 0.12, 0.07, 0.03, 0.28 a) Using a calculator find Q1, Q3, median and IQR b) Determine the lower and upper fences. (Show work) c) Identify the outliers (if any) in this setarrow_forward
- 1. Compare the results of the Paasche versus the Laspeyres Index for the year 1984?arrow_forwardUse the accompanying data table regarding retirement funds. Complete parts (a) through (d) below. a. Construct a growth and value table that tabulates type, market cap, risk,and rating.arrow_forwardPrice information for selected foods for 2010 and 2018 is given in the table. Price Quantity Item 2010 2018 2010 2018 Cabbage (pound) $ 0.06 $ 0.05 2,000 1,500 Carrots (bunch) 0.10 0.12 200 200 Peas (quart) 0.20 0.18 400 500 Endive (bunch) 0.15 0.15 100 200 Compute a simple price index for each of the four items. Use 2010 as the base period. (Round your answers to 2 decimal places.)arrow_forward
 MATLAB: An Introduction with ApplicationsStatisticsISBN:9781119256830Author:Amos GilatPublisher:John Wiley & Sons Inc
 Probability and Statistics for Engineering and th...StatisticsISBN:9781305251809Author:Jay L. DevorePublisher:Cengage Learning
 Statistics for The Behavioral Sciences (MindTap C...StatisticsISBN:9781305504912Author:Frederick J Gravetter, Larry B. WallnauPublisher:Cengage Learning
 Elementary Statistics: Picturing the World (7th E...StatisticsISBN:9780134683416Author:Ron Larson, Betsy FarberPublisher:PEARSON
 The Basic Practice of StatisticsStatisticsISBN:9781319042578Author:David S. Moore, William I. Notz, Michael A. FlignerPublisher:W. H. Freeman
 Introduction to the Practice of StatisticsStatisticsISBN:9781319013387Author:David S. Moore, George P. McCabe, Bruce A. CraigPublisher:W. H. Freeman