Videos
Approximately 1.5 million high school students take the SAT each year and nearly 80% of colleges and universities without open admissions policies use SAT scores in making admission decisions. The current version of the SAT includes three parts: reading comprehension, mathematics, and writing. A perfect combined score for all three parts is 2400. A sample of SAT scores for the combined three-part SAT is as follows.

a. Show a frequency distribution and histogram. Begin with the first class starting at 800 and use a class width of 200.
b. Comment on the shape of the distribution.
c. What other observations can be made about the SAT scores based on the tabular and graphical summaries?
(a)
To Check:
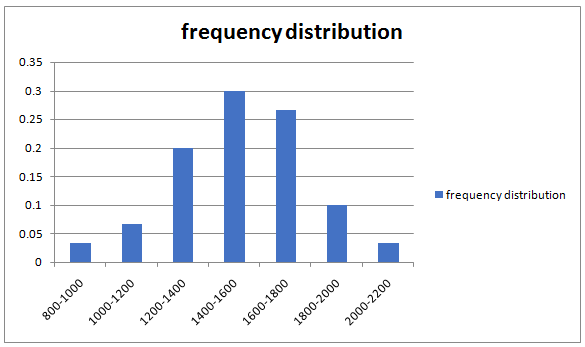
Show a frequency distribution and histogram.
Answer to Problem 44SE
| Class | Frequency | Frequency distribution |
| 800-1000 | 1 | 1/30 =0.033 |
| 1000-1200 | 2 | 2/30 = 0.066 |
| 1200-1400 | 6 | 6/30 =0.2 |
| 1400-1600 | 9 | 9/30= 0.3 |
| 1600-1800 | 8 | 8/30= 0.266 |
| 1800-2000 | 3 | 3/30= 0.1 |
| 2000-2200 | 1 | 1/30=0.033 |
Explanation of Solution
Let's make a table with a class width of 200 to show frequency distribution.
Frequency distribution can be calculated as
Frequency distribution of a class = Number of values falling in that class/ total number of values in the data set.
| class | frequency | Frequency distribution |
| 800-1000 | 1 | 1/30 =0.033 |
| 1000-1200 | 2 | 2/30 = 0.066 |
| 1200-1400 | 6 | 6/30 =0.2 |
| 1400-1600 | 9 | 9/30= 0.3 |
| 1600-1800 | 8 | 8/30= 0.266 |
| 1800-2000 | 3 | 3/30= 0.1 |
| 2000-2200 | 1 | 1/30=0.033 |
(b)
To Check:
Comment on the shape of the distribution
Answer to Problem 44SE
While looking at the histogram we can see that the distribution is roughly Normal distribution but is right skewed.
Explanation of Solution
While looking at the histogram we can see that the distribution is roughly Normal distribution but is right skewed.
(c)
To Check:
What other observations can be made from graph and table
Answer to Problem 44SE
SAT score between1400 − 1600 is most frequent. None of the students scored above 2200
Explanation of Solution
After looking at the table and the histogram we can see that SAT score between1400 − 1600 is most frequent. None of the students scored above 2200
Want to see more full solutions like this?
Chapter 2 Solutions
Essentials of Modern Business Statistics with Microsoft Office Excel (with XLSTAT Education Edition Printed Access Card) (MindTap Course List)


 Holt Mcdougal Larson Pre-algebra: Student Edition...AlgebraISBN:9780547587776Author:HOLT MCDOUGALPublisher:HOLT MCDOUGAL
 Glencoe Algebra 1, Student Edition, 9780079039897...AlgebraISBN:9780079039897Author:CarterPublisher:McGraw Hill
 Big Ideas Math A Bridge To Success Algebra 1: Stu...AlgebraISBN:9781680331141Author:HOUGHTON MIFFLIN HARCOURTPublisher:Houghton Mifflin Harcourt