
a)
To Analyze: The effect, on the exchange rate between yen and dollar when Japan opens domestic market to more foreign competition, by using supply-and-
a)
Answer to Problem 1TY
The exchange rate for American dollars increases when Japan opens domestic market to more number of foreign countries.
Explanation of Solution
The below mentioned diagram shows the exchange rate being determined based on the supply of dollars in the foreign exchange market.
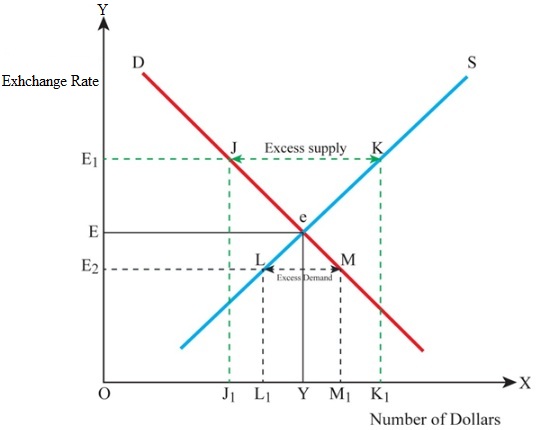
In the above mentioned graph the
At the point e, the demand for dollar becomes equal to the supply of dollars, and this point is considered as the equilibrium point. For the dollar at Y, the exchange rate will be E. The supply of dollar is K, for the demand for dollar j, and the excess of dollar supply will cause decrease in the value of dollar, subsequent decrease in the exchange rate from
When Japan opens its domestic market to foreign countries, the import also increases, causing an increase in the demand for American dollars in the foreign exchange market. The value of dollar will be appreciated with increase in its demand, thus increasing the exchange rate.
b)
To Analyze: The effect, on the exchange rate between yen and dollar when the value in Tokyo stock market is believed to be falling, by the investors using the supply-and-demand diagrams.
b)
Answer to Problem 1TY
As there is an outflow of funds in order to invest in American Stock Exchange, there will be an increase in the exchange rate also.
Explanation of Solution
The below mentioned diagram shows the exchange rate being determined based on the supply of dollars in the foreign exchange market.
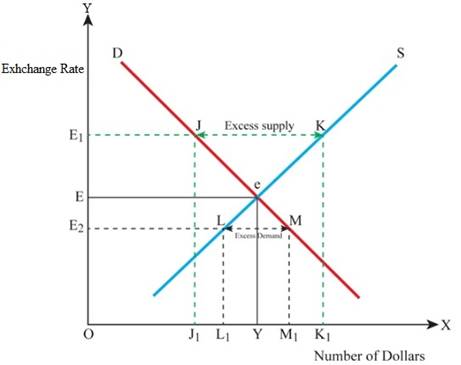
In the above mentioned graph the
At the point e, the demand for dollar becomes equal to the supply of dollars, and this point is considered as the equilibrium point. For the dollar at Y, the exchange rate will be E. The supply of dollar is K, for the demand for dollar j, and the excess of dollar supply will cause a decrease in the value of dollar, subsequently resulting in a decrease in the exchange rate from
When the investors feel that the value in Tokyo Stock Market is falling, they will start diverting their investments in to American Stock Market. Thus, there will be a capital outflow from Japan to America, which in turn will increase the demand for American dollars in the foreign exchange and the value of dollar also increases. Subsequently there will be an increase in the exchange rate.
c)
To Analyze: The effect, on the exchange rate between yen and dollar when the interest rates are cut by FR in United States, by using supply-and-demand diagrams.
c)
Answer to Problem 1TY
When there is a cut in interest rates by FR, the value of yen increases in foreign exchange and the exchange rate of dollar decreases.
Explanation of Solution
The below mentioned diagram shows the exchange rate being determined based on the supply of dollars in the foreign exchange market.
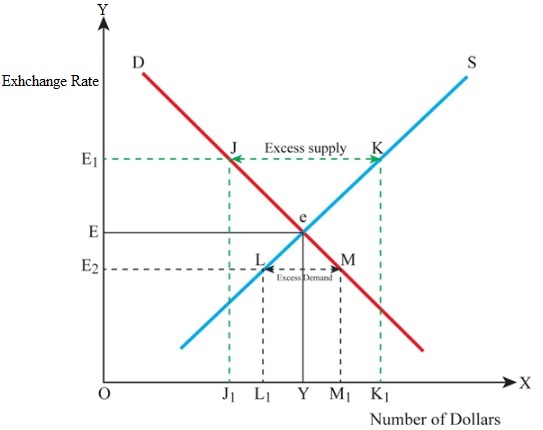
In the above mentioned graph the
At the point e, the demand for dollar becomes equal to the supply of dollars, and this point is considered as the equilibrium point. For the dollar at Y, the exchange rate will be E. The supply of dollar is K, for the demand for dollar j, and the excess of dollar supply will cause decrease in the value of dollar, subsequently causing a decrease in the exchange rate from
As there is a cut in interest rates in FR, investors will be attracted to higher interest rates being offered by Japan and starts diverting their investments to Japan. Thus the demand for Japanese Yen becomes more in the foreign exchange market, increasing the value of yen against that of dollar, thus decreasing the exchange rate of dollar.
d)
To Analyze: The effect, on the exchange rate between yen and dollar, when huge amounts of foreign aid is given to Israel and her Arab neighbors, by the United States, in order to settle problems in Middle East, by using supply-and-demand diagrams.
d)
Answer to Problem 1TY
When United States gives huge sum of money for settling problems in Middle East, the value of dollar decreases and hence its exchange rate also decreases.
Explanation of Solution
The below mentioned diagram shows the exchange rate being determined based on the supply of dollars in the foreign exchange market.
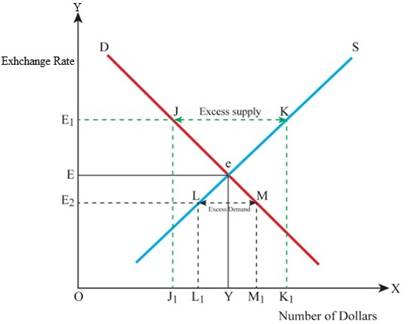
In the above mentioned graph the
At the point e, the demand for dollar becomes equal to the supply of dollars, and this point is considered as the equilibrium point. For the dollar at Y, the exchange rate will be E. The supply of dollar is K, for the demand for dollar j, and the excess of dollar supply will cause a decrease in the value of dollar, subsequently resulting in a decrease in the exchange rate from
When huge amounts of aid is given to Israel and her neighbors to settle problems in Middle East, there will be an increase in supply of dollars in to the foreign exchange market, which in turn decreases the value of dollar thus decreasing its exchange rate.
e)
To Analyze: The effect, on the exchange rate between yen and dollar, when there is recession in United States and boom in Japan, by using supply-and-demand diagrams.
e)
Answer to Problem 1TY
When there is recession in United States, the value of dollar increases thereby increasing its exchange rate.
Explanation of Solution
The below mentioned diagram shows the exchange rate being determined based on the supply of dollars in the foreign exchange market.
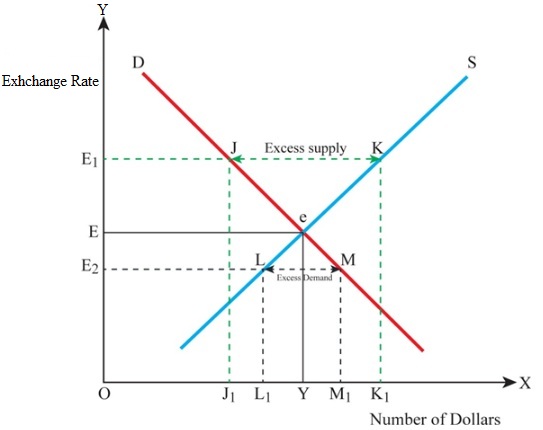
In the above mentioned graph the
At the point e, the demand for dollar becomes equal to the supply of dollars, and this point is considered as the equilibrium point. For the dollar at Y, the exchange rate will be E. The supply of dollar is K, for the demand for dollar j, and the excess of dollar supply will cause a decrease in the value of dollar, subsequently causing a decrease in the exchange rate from
When there is recession in United States, its imports decreases and export increases, and when there is a boom in Japan, its imports increases and export decreases. Thus the demand for Yen by United States decreases, while the demand for dollar by Japan increases, increasing the value of dollar, and thereby increase in its exchange rate.
f)
To Analyze: The effect, on the exchange rate between yen and dollar, when inflation in United States exceeds than that in Japan, by using supply-and-demand diagrams.
f)
Answer to Problem 1TY
When there is inflation in the United States more than that in Japan, then the value of dollar decreases, thereby decreasing its exchange rate.
Explanation of Solution
The below mentioned diagram shows the exchange rate being determined based on the supply of dollars in the foreign exchange market.
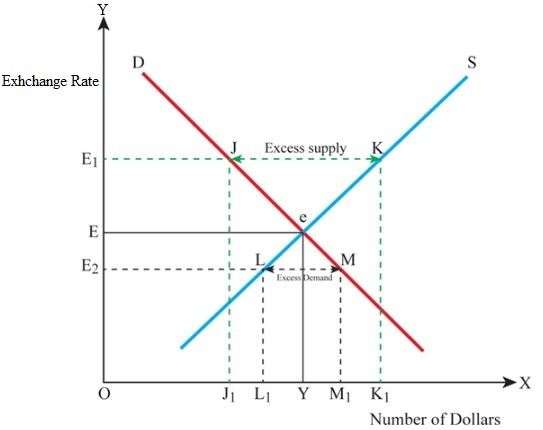
In the above mentioned graph the
At the point e, the demand for dollar becomes equal to the supply of dollars, and this point is considered as the equilibrium point. For the dollar at Y, the exchange rate will be E. The supply of dollar is K, for the demand for dollar j, and the excess of dollar supply will cause decrease in the value of dollar, subsequently resulting in decrease in the exchange rate from
When there is inflation in United States than that of Japan, the imports in United States increases, which increases the supply of dollars in foreign exchange market. This decreases the value of dollar, thereby decreasing its exchange rate.
Want to see more full solutions like this?
Chapter 19 Solutions
Macroeconomics: Principles and Policy (MindTap Course List)
- In April 2002, the price of a Big Mac in the UK was £1.99. Using data from The Economist's Big Mac Index for April 2002, the following table shows the local currency price of a Big Mac in several countries and the actual exchange rate. At the time, a Big Mac in the United States would have cost you 2.49 pounds. The actual exchange rate between the pound and the euro was £0.69 per British pound. The euro price of a Big Mac in the United States was, therefore, 2.49 British pounds x £0.69 per British pound = £1.71, which is less than you'd have paid in the UK. For the price you paid for a Big Mac in the UK, you could have purchased a Big Mac in the United States and had some change left over for french fries. Big Mac Index: April 2002 Country Local Price Actual Exchange Rate Argentina 2.49 pesos £0.23 per peso Brazil 3.6 reais £0.29 per real United States 2.49 pounds £0.69 per pound Euro zone 2.67 euros £0.62 per euro Poland 5.9 zloty £0.17 per zloty Switzerland 6.3 francs £0.42 per franc…arrow_forwardDescribe how each of the following transactions affects the U.S. Balance of Payments. (Recall that each transaction gives rise to two entries in the Balance-of-Payments Accounts.) (a) A French consumer imports American jeans and pays with a check drawn on a U.S. bank in Philadelphia. (b) An American company sells computer software to Costa Rica and receives a money order of $120,000. (c) A citizen from Italy enters the United States on an immigrant visa (that is, upon entering the United States she becomes a permanent resident of the United States). Her wealth in Italy is estimated to be about 1.5 billion U.S. dollars. (d) Frank Rogers, of Durham, buys 2,300.00 dollars of stocks from the German car maker BMW, from Citibank New York, paying with U.S. dollars. (e) An American company sells a subsidiary in the United States and with the proceeds buys a Romanian company. (f) The United States forgives debt of $3,200,000 to Canada. (g) An American family travels to…arrow_forwardOn the following graph, use the grey point (star symbol) to show the new exchange rate resulting from an increase in the world demand for coffee. EXCHANGE RATE 10 8 2 0 0 The market for foreign exchange 20 S₁ D 1 40 60 QUANTITY (Millions of reais) 80 Ceiling Floor D2 100 New Exchange Rate Action (?)arrow_forward
- Suppose that the Federal Reserve cannot convince the public of its commitment to fight inflation in the United States in the near future. a) What would be the effect on the expected appreciation of the U.S. dollar? b) What would be the effect on the spot exchange rate for the U.S. dollar? Explain your answer using a graph.arrow_forwardYou read in the paper that the dollar has strengthened in value relative to the euro. How is this change in the exchange rate value of the dollar likely to affect exports to Europe and imports from Europe?arrow_forwardWhich of the following affects the demand for U.S. dollars in the foreign exchange market? Multiple Choice domestic demand for U.S. stocks domestic demand for U.S.-made cars foreign demand for U.S. exports European demand for eurosarrow_forward
- Balance of payments accounting. For the following international transactions, identify the balance of payments accounts and whether the transaction would generate an inflow or an outflow of foreign exchange for the two countries involved. ■ TIAA-CREF—the pension fund of American college professors—purchases 1 million shares of South Africa’s Standard Bank for $16 million. ■ Air France purchases $2.5 million of jet fuel at Boston’s Logan Airport. Payment is made directly from Air France’s bank account with State Street in Boston. ■ Hong Kong–based Cathay Pacific pays a $25 million annual lease on two Boeing 777s to U.S.-based lessor GE Capital.arrow_forwardFor each of the following transactions, show the two entries in the US balance of payments. For each entry, indicate whether it appears in CA (the current account) or KFA (the capital and financial account). Show if each entry is a debit (-) or a credit (+). For entries in KFA, choose the appropriate explanation from the following four possibilities: i) increase in US-owned assets abroad (increase in US claims on foreigners), ii) decrease in US-owned assets abroad (decrease in US claims on foreigners), iii) increase in foreign-owned assets in the US (increase in foreign claims on the US), iv) decrease in foreign-owned assets in the US (decrease in foreign claims on the US). A. A US exporter sells a car to a German importer. The importer pays with a dollar denominated check drawn on a US bank account.arrow_forwardAnswer the followings: 1. A depreciation of the dollar on the foreign exchange market would result in: A) a decrease in the dollar prices paid by U.S. importers. B) foreign holidays for U.S. residents to be less expensive. C) a decrease in the demand for U.S. exports. D) an increase in the foreign currency prices paid for U.S. exports. 2. The exchange rate for one U.S. dollar is 1.2 Euros and 1.5 British pounds. Exactly six months later, the exchange rate for one U.S. dollar is 0.9 Euro and 1.7 British pounds. We can say: A) the dollar has depreciated relative to both British pounds and Euros. B) the dollar has appreciated relative to both British pounds and Euros. C) the dollar has appreciated relative to Euros and depreciated relative to British pounds. D) the dollar has appreciated relative to British pounds and depreciated relative to Euros. 3. The cost of a trip to New York, US, was $5000. Two weeks later, the US dollar appreciated against the British pound. If the price of the…arrow_forward
- The following paragraphs discuss the impact of various economic events on the exchange rate. Complete the paragraphs by filling in the blanks. Use any of the words from the following list (you can use each of these words as many times as you wish but choose carefully - your sentence must make grammatical sense):demand supply left right buy sell imports exports rise fall increases decreases What happens to the current account balance and the exchange rate when the following happens? Suppose that New Zealand firms become more profitable relative to foreign firms and so increase their payment of dividends (everything else held constant). The value for net foreign income therefore ________ and the value of the current account balance will _______. Payment of NZ dividends to foreign owners affects the _______ or/of $NZ while payments of foreign dividends to NZ owners of foreign companies affects the _______ for/of $NZ. Therefore the impact of the change in profit of NZ firms is…arrow_forwardAn appreciation of the dollar against all currencies in the foreign exchange market would result in all of the following, except: a) a decrease in the dollar prices paid by U.S. importers. b) an increase in the cost of vacations in Florida for Japanese tourists. c) foreign holidays for U.S. residents to be less expensive. d) an increase in the foreign currency prices paid for U.S. exports. e) an increase in the demand for U.S. exports.arrow_forwardThe spot exchange rate between the dollar and the Swiss franc is a floating, or flexible, rate. What are the effects of each of the following on this exchange rate? There is a large increase in Swiss demand for U.S. exports as U.S. culture becomes more popular in Switzerland. There is a large increase in Swiss demand for investments in U.S. dollar-denominated financial assets because of a Swiss belief that the U.S. economy and political situation are improving markedly. Political uncertainties in Europe lead U.S. investors to shift their financial investments out of Switzerland, back to the United States. U.S. demand for products imported from Switzerland falls significantly as bad press reports lead Americans to question the quality of Swiss products.arrow_forward
 Economics (MindTap Course List)EconomicsISBN:9781337617383Author:Roger A. ArnoldPublisher:Cengage Learning


 Exploring EconomicsEconomicsISBN:9781544336329Author:Robert L. SextonPublisher:SAGE Publications, Inc


