Financial Accounting
14th Edition
ISBN: 9781305088436
Author: Carl Warren, Jim Reeve, Jonathan Duchac
Publisher: Cengage Learning
expand_more
expand_more
format_list_bulleted
Videos
Textbook Question
Chapter 17, Problem 3CP
The condensed income statements through income from operations for Dell Inc. and Apple Inc. for recent fiscal years follow (numbers in millions of dollars):
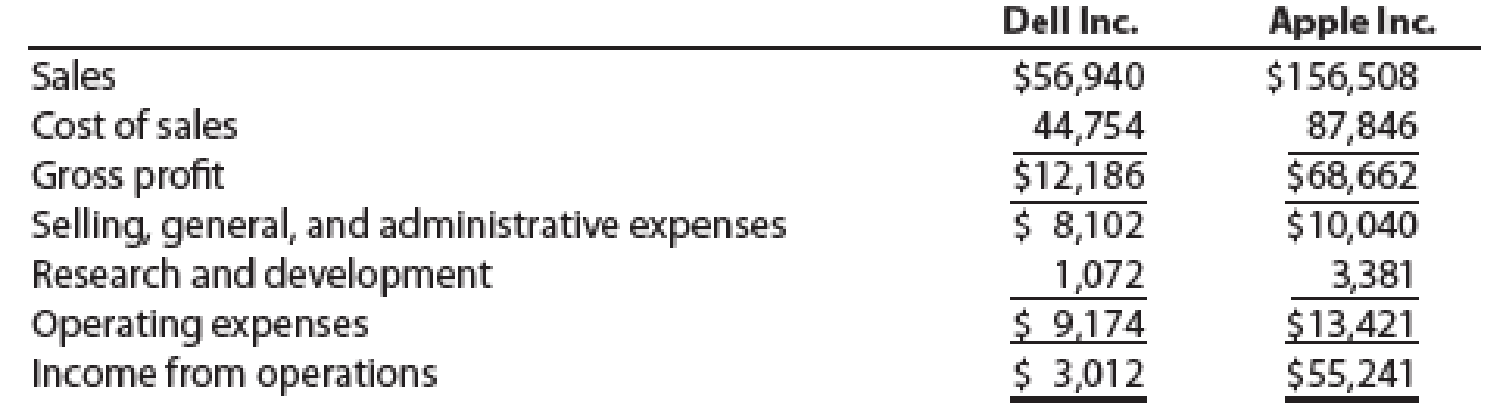
 Prepare comparative common-sized statements, rounding percents to one decimal place. Interpret the analyses.
Expert Solution & Answer
Want to see the full answer?
Check out a sample textbook solution
Students have asked these similar questions
The condensed income statements through income from operations for Amazon.com, Inc., Best Buy, Inc., and Wal-Mart Stores, Inc. for a recent fiscal year follow (in millions):
Please see the attachment for details:
1. Prepare comparative common-sized income statements for each company. Round percentages to one decimal place.2. Use the common-sized analysis to compare the financial performance ofthe three companies.
Income statement data for Winthrop Company for two recent years ended December 31 are as follows:
Please see the attachment for details:
a. Prepare a comparative income statement with horizontal analysis, indicating the increase (decrease) for the current year when compared with the previous year. Round percentages to one decimal place.b. What conclusions can be drawn from the horizontal analysis?
Prepare a comparative common-size income statement for Jubilee Corporation. To an investor, how does the current year compare with the prior year? Explain your reasoning.
E (Click the icon to view the comparative income statement.)
Data table
Start by calculating the percentages. (Round the percentages to two decimal places, X.XX.)
Jubilee Corporation
Comparative Common-Size Income Statement
A
C
For the Years Ended December 31
1
Jubilee Corporation
Current
2
Income Statement
year
Prior year
3
For the Years Ended December 31
Sales revenues
100.00 %
100.00 %
4
(amounts in thousands)
Less: Cost of goods sold
%
%
Current
Gross profit
%
%
year
Prior year
Less: Operating expenses
%
6 Sales revenues
$
494,208 $
429,000
%
Operating income
%
7 Less: Cost of goods sold
172,640
160,000
Less: Interest expense
8 Gross profit
2$
321,568 $
269,000
0%
Income before income taxes
%
%
9 Less: Operating expenses
143,370
135,000
Less: Income tax expense
10 Operating income
2$
178,198 $
134,000
%
%
11 Less:…
Chapter 17 Solutions
Financial Accounting
Ch. 17 - Prob. 1DQCh. 17 - What is the advantage of using comparative...Ch. 17 - Prob. 3DQCh. 17 - How would the current and quick ratios of a...Ch. 17 - Prob. 5DQCh. 17 - What do the following data, taken from a...Ch. 17 - a. How does the rate earned on total assets differ...Ch. 17 - Kroger, a grocery store, recently had a...Ch. 17 - Prob. 9DQCh. 17 - Prob. 10DQ
Ch. 17 - Prob. 1PEACh. 17 - Prob. 1PEBCh. 17 - Prob. 2PEACh. 17 - Vertical analysis Income statement information for...Ch. 17 - Prob. 3PEACh. 17 - Prob. 3PEBCh. 17 - Prob. 4PEACh. 17 - Prob. 4PEBCh. 17 - Prob. 5PEACh. 17 - Inventory analysis A company reports the...Ch. 17 - Prob. 6PEACh. 17 - Prob. 6PEBCh. 17 - Times interest earned A company reports the...Ch. 17 - Times interest earned A company reports the...Ch. 17 - Asset turnover A company reports the following:...Ch. 17 - Asset turnover A company reports the following:...Ch. 17 - Prob. 9PEACh. 17 - Prob. 9PEBCh. 17 - Common stockholders' profitability analysis A...Ch. 17 - Common stockholders' profitability analysis A...Ch. 17 - Earnings per share and price-earnings ratio A...Ch. 17 - Earnings per share and price-earnings ratio A...Ch. 17 - Revenue and expense data for Gresham Inc. for two...Ch. 17 - Prob. 2ECh. 17 - Common-sized income statement Revenue and expense...Ch. 17 - Prob. 4ECh. 17 - Prob. 5ECh. 17 - The following data were taken from the balance...Ch. 17 - Prob. 7ECh. 17 - The bond indenture for the 10-year, 9% debenture...Ch. 17 - The following data are taken from the financial...Ch. 17 - Prob. 10ECh. 17 - The following data were extracted from the income...Ch. 17 - Prob. 12ECh. 17 - Ratio of liabilities to stockholders equity and...Ch. 17 - Hasbro and Mattel, Inc., are the two largest toy...Ch. 17 - Ratio of liabilities to stockholders equity and...Ch. 17 - Three major segments of the transportation...Ch. 17 - Prob. 17ECh. 17 - Profitability ratios Ralph Lauren Corporation...Ch. 17 - The following data were taken from the financial...Ch. 17 - The balance sheet for Garcon Inc. at the end of...Ch. 17 - Earnings per share, price-earnings ratio, dividend...Ch. 17 - The table that follows shows the stock price,...Ch. 17 - Earnings per share, discontinued operations The...Ch. 17 - Prob. 24ECh. 17 - Prob. 25ECh. 17 - Unusual items Explain whether Colston Company...Ch. 17 - Prob. 1PACh. 17 - For 2016, Indigo Company initiated a sales...Ch. 17 - Effect of transactions on current position...Ch. 17 - The comparative financial statements of Bettancort...Ch. 17 - Addai Company has provided the following...Ch. 17 - Prob. 1PBCh. 17 - Prob. 2PBCh. 17 - Effect of transactions on current position...Ch. 17 - Prob. 4PBCh. 17 - Crosby Company has provided the following...Ch. 17 - Financial Statement Analysis The financial...Ch. 17 - Prob. 1CPCh. 17 - Prob. 2CPCh. 17 - The condensed income statements through income...Ch. 17 - Prob. 4CPCh. 17 - Marriott International, Inc., and Hyatt Hotels...
Knowledge Booster


Learn more about
Need a deep-dive on the concept behind this application? Look no further. Learn more about this topic, accounting and related others by exploring similar questions and additional content below.Similar questions
- The following data (in millions) are taken from recent financial statements of Nike Inc.: a. Determine the amount of change (in millions) and percent of change in net income for Year 2. Round to one decimal place. b. Determine the percentage relationship between net income and net sales (net income divided by net sales) for Year 2 and Year 1. Round to one decimal place. c. What conclusions can you draw from your analysis?arrow_forwardStarbucks Corporation reported the following geographical segment revenues for a recent and a prior fiscal year: a. Prepare a horizontal analysis of the segment data using the prior year as the base year. Round whole percents to one decimal place. b. Prepare a vertical analysis of the segment data. Round whole percents to one decimal place. c. What conclusions can be drawn from your analyses?arrow_forwardSome recent financial statements for Smolira Golf Corporation follow. Find the following financial ratios for Smolira Golf Corporation (use year-end figures rather than average values where appropriate): (Enter the profitability ratio answers as a percent rounded to 2 decimal places, e.g., 32.16. Round the remaining answers to 2 decimal places, e.g., 32.16.)arrow_forward
- A. Prepare a comparative income statement with horizontal analysis, indicating the increase (decrease) for the current year when compared with the previous year. Round percentages to one decimal place. B. What conclusions can be drawn from the horizontal analysis? Round the answers to one decimal place.arrow_forwardPrepare a comparative income statement with horizontal analysis, indicating the increase (decrease) for the current year when compared with the previous year. If required, round to one decimal place. Yesarrow_forwardRefer to the information for Cuneo Company above.Required:1. Prepare a common-size income statement for Year 2 by expressing each line item for Year2 as a percentage of that same line item from Year 1. (Note: Round percentages to thenearest tenth of a percent.)2. Prepare a common-size income statement for Year 3 by expressing each line item for Year3 as a percentage of that same line item from Year 1. (Note: Round percentages to thenearest tenth of a percent.)arrow_forward
- Identify any favorable and unfavorable trends in the following income statements by preparing a vertical analysis. Write a paragraph explaining what you find. (Round percentages to two decimal places.) Becker Corporation Income Statements For the Years Ended December 31 Year 2 Revenues Operating expenses: Wages expense Rent expense Utilities expense Interest expense Total operating expenses Net income Year 1 $394,000 $212,500 $ 79,000 $ 65,000 19,000 21,000 7,500 18,000 14,200 7,800 $126,500 $105,000 $267,500 $107,500arrow_forwardRefer to the information for Sundahl Company on the previous page.Required:1. Prepare a common-size income statement for Year 1 by expressing each line item as apercentage of sales revenue. (Note: Round percentages to the nearest tenth of a percent.)2. Prepare a common-size income statement for Year 2 by expressing each line item as apercentage of sales revenue. (Note: Round percentages to the nearest tenth of a percent.)arrow_forwarda. Prepare a comparative income statement with horizontal analysis, indicating the increase (decrease) for the current year when compared with the previous year. If required, round to one decimal place.arrow_forward
- Loomis, Inc. reported the following on the company’s income statement in two recent years: Please see the image for details: a. Determine the times interest earned ratio for the current year and the prior year. Round to one decimal place.b. Is this ratio improving or declining?arrow_forwardSome recent financial statements for Smolira Golf Corporation follow. Find the following financial ratios for Smolira Golf Corporation (use year-end figures rather than average values where appropriate): (Enter the profitability ratio answers as a percent rounded to 2 decimal places, e.g., 32.16. Round the remaining answers to 2 decimal places, e.g., 32.16.) a. Profitability Ratios Profit margin % Return on Assets % Return on Equity % b. Asset utilization ratios: Total asset turnover times Inventory turnover times Receivables turnover timesarrow_forwardRevenue and expense data for the current calendar year for Tannenhill Company and for the electronics industry are as follows. Tannenhill’s data are expressed in dollars. The electronics industry averages are expressed in percentages. Please see the attachment for details: a. Prepare a common-sized income statement comparing the results of operations for Tannenhill Company with the industry average. Round to the nearest whole percentage.b. As far as the data permit, comment on significant relationships revealed by the comparisons.arrow_forward
arrow_back_ios
SEE MORE QUESTIONS
arrow_forward_ios
Recommended textbooks for you
 Financial AccountingAccountingISBN:9781305088436Author:Carl Warren, Jim Reeve, Jonathan DuchacPublisher:Cengage Learning
 Managerial AccountingAccountingISBN:9781337912020Author:Carl Warren, Ph.d. Cma William B. TaylerPublisher:South-Western College Pub
 Financial AccountingAccountingISBN:9781337272124Author:Carl Warren, James M. Reeve, Jonathan DuchacPublisher:Cengage Learning
 Managerial Accounting: The Cornerstone of Busines...AccountingISBN:9781337115773Author:Maryanne M. Mowen, Don R. Hansen, Dan L. HeitgerPublisher:Cengage Learning
Financial Accounting
Accounting
ISBN:9781305088436
Author:Carl Warren, Jim Reeve, Jonathan Duchac
Publisher:Cengage Learning
Managerial Accounting
Accounting
ISBN:9781337912020
Author:Carl Warren, Ph.d. Cma William B. Tayler
Publisher:South-Western College Pub
Financial Accounting
Accounting
ISBN:9781337272124
Author:Carl Warren, James M. Reeve, Jonathan Duchac
Publisher:Cengage Learning
Managerial Accounting: The Cornerstone of Busines...
Accounting
ISBN:9781337115773
Author:Maryanne M. Mowen, Don R. Hansen, Dan L. Heitger
Publisher:Cengage Learning
How To Analyze an Income Statement; Author: Daniel Pronk;https://www.youtube.com/watch?v=uVHGgSXtQmE;License: Standard Youtube License