
Videos
(a)
Construction of a table that shows the relation of equilibrium output in the short run and inflation rate.
(a)
Explanation of Solution
The planned aggregate expenditure is the sum of consumption, planned investment, government spending, and net export. The equation that connects the planned spending to output and real rate interest can be derived as follows:
Thus, the equation for PAE is derived as
Thus, the autonomous expenditure is 4,830.
The equilibrium output in the short run can be calculated by fixing PAE, which is equal to the output (Y). The equilibrium output (Y) can be calculated by substituting the equation
Thus, the equilibrium output in the short run is 12,075.
Similarly, substitute each value of the rate of interest in the equation
Table 1
| Rate of inflation | Real inflation rate | Autonomous expenditure | Equilibrium output |
| 0 | 0.04 | 4,830 | 12,075 |
| 0.01 | 0.045 | 4,815 | 12,038 |
| 0.02 | 0.05 | 4,800 | 12,000 |
| 0.03 | 0.055 | 4,785 | 11,963 |
| 0.04 | 0.06 | 4,770 | 11,925 |
With the equilibrium output, the aggregate demand curve is graphically represented below:
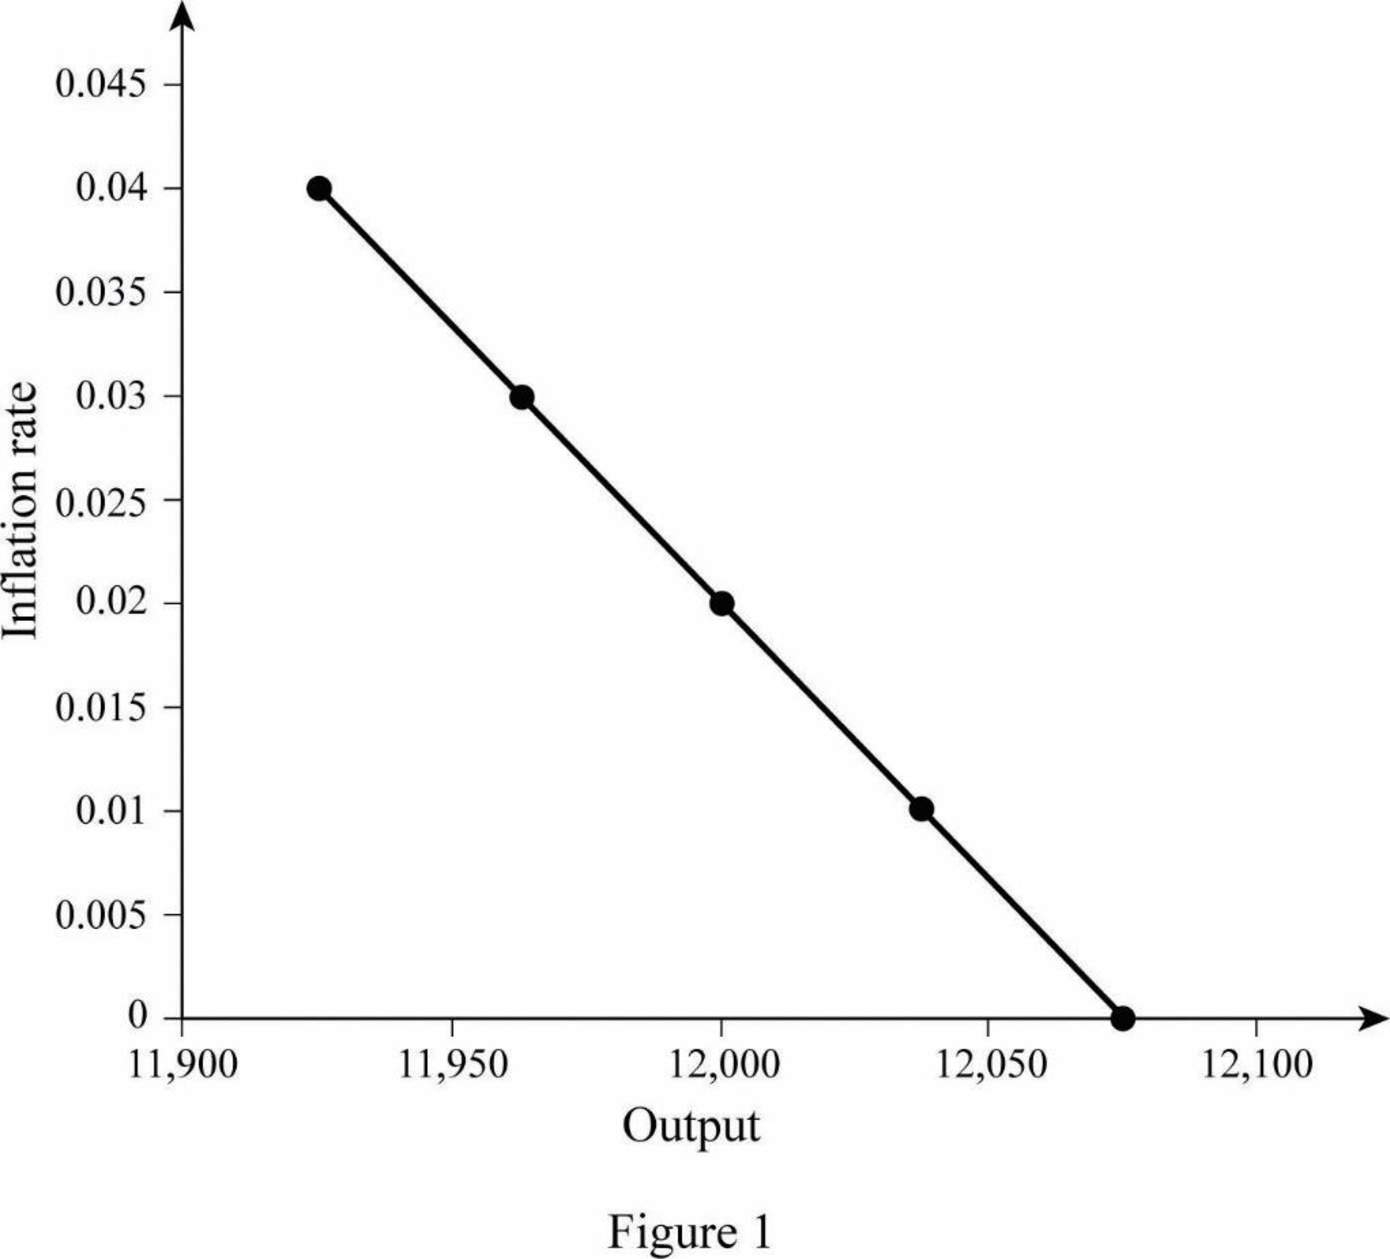
In Figure 1, the horizontal axis represents the output, and the vertical axis represents the rate of inflation. The curve AD is the aggregate demand curve, which refers to the total value of the goods and services that are demanded at each price or inflation rate in a given period of time.
(b)
Construction of a table that shows the relation of equilibrium output in the short run and inflation rate when the Fed reduces the real rate of interest.
(b)
Explanation of Solution
The equation for PAE is derived as
Thus, the autonomous expenditure is 4,845.
The equilibrium output in the short run can be calculated by fixing PAE, which is equal to the output (Y). The equilibrium output (Y) can be calculated by substituting the equation
Thus, the equilibrium output in the short run is around 12,113.
Similarly, substitute each value of rate of interest in the equation
Table 2
| Rate of inflation | Real inflation rate | Autonomous expenditure | Equilibrium output |
| 0 | 0.035 | 4,845 | 12,113 |
| 0.01 | 0.04 | 4,830 | 12,075 |
| 0.02 | 0.045 | 4,815 | 12,038 |
| 0.03 | 0.05 | 4,800 | 12,000 |
| 0.04 | 0.055 | 4,785 | 11,963 |
Table-2 shows the autonomous expenditure and equilibrium output at each level of inflation rate with a new real rate of interest. While comparing Tables 1 and 2, it is clear that the autonomous expenditure increases about 15 at each level of inflation rate. In the case of equilibrium output, it is increased about 38. This increase in aggregate demand will lead to a shift in the AD curve to the right because the Fed adopts easing of monetary policy, which means, the Fed reduced the real rate of interest and thereby cause a downward shift of reaction curve. As a result, AD curve shifts to the right.
Want to see more full solutions like this?
Chapter 15 Solutions
PRINCIPLES OF MACROECONOMICS(LOOSELEAF)


- C = 100 + 0.5 · (Y – T) I = 500 – 1000 -r where Y is real output and r is the real interest rate. Government purchases and taxes are Ğ = 500, Ť= 100. The LM (money market equilibrium) curve is Y 5i where P is the price level and i is the nominal interest rate. The Central Bank (CB) is initially supplying M = 8000 units of money, and expected inflation is a = 0. Assume that the long-run equilibrium level of output is Y = 2000. Short-run equilibrium output is initially at the same level (Y = 2000). Suddenly, news of a new world-beating super-vaccine raises expected inflation to = 0.05. 1. Suppose the government (not the CB) wants to stabilise the shock in the short-run. Explain whether it should inerease the government deficit (AĞ > AT) or reduce it (AĞ < AŤ), and how it works. 2. Now suppose the government doesn't do anything, and the CB wants to stabilise the shock in the short-run. Explain whether it should decrease or increase money supply M if it wants to bring output Y back to its…arrow_forwardSuppose that the level of unemployment in the economy is determined by the follow equation: U = 7.55 1.88*(i - ie) Where U is the unemployment rate, i is the actual inflation rate, and it is the expected inflation rate. All variables are entered in percentage form (e.g. if inflation is 30.57%, you plug in 30.57 for i, not 0.3057). Last year, the inflation rate was 7.87%, and people have adaptive expectations. What does the inflation rate need to be this year in order for the unemployment rate to be 2.81%? Note: Everything is already in percentage form. You do not need to multiply or divide by 100 at any point. Enter in your answer as it is calculated in the equation. Round your final answer to two decimal places.arrow_forwardThe country of Freeland has an aggregate demand curve determined by the equation M + U = 6% Freeland also has a potential growth rate of 2%. Using this information, draw Freeland's aggregate demand (AD) and long-run aggregate supply (LRAS) curves on the graph. Inflation rate (%) 12 11 10 9 8 7 6 5 4 3 2 1 0 -2 -1 0 LRAS 1 2 3 3 4 5 6 Real GDP growth rate (%) prevailing inflation rate: What is the prevailing inflation rate in Freeland? AD What is the prevailing real GDP growth rate? prevailing real GDP growth rate: 7 8 9 10 % %arrow_forward
- C = 100 + 0.5 - (Y – T) I = 500 – 1000 -r where Y is real output and r is the real interest rate. Government purchases and taxes are G = 500, Ť= 100. The LM (money market equilibrium) curve is M Y P where P is the price level and i is the nominal interest rate. The Central Bank (CB) is initially supplying M = 8000 units of money, and expected inflation is a = 0. Assume that the long-run equilibrium level of output is Y = 2000. Short-run equilibrium output is initially at the same level (Y = 2000). Suddenly, news of a new world-beating super-vaccine raises expected inflation to = 0.05. 1. Explain how the short-run values of (r, i) are determined before the vaccine news shock. 2. Which, if any, of the graphs from Appendix C best depicts the change in the Keynesian cross due to the vaccine news shock? Explain. 3. Which, if any, of the graphs from Appendix A best depicts the short-run change in the interest rate(s) due to the vaccine news shock? Explain. 4. Which, if any, of the graphs…arrow_forwardIf a firm believes that their relative price has changed, then they will increase their output, since their product is more valuable (in relative price terms). Thus, the output of firms will be Y = Y +x (P - EP) where alpha is the relative increase in work driven by an increase in expected price level Thirty percent of firms can adjust their prices ex-post. If a=1, and the current price level is $200, then draw the SRAS curve around the potential output of $10,000. Then, determine the increase in price above expectation if 40% of firms are sticky-price firms, flexible price firms respond with a=0.02 and Y rises by $2400.arrow_forwardBased on research conducted by the Department of Economic Analysis, the government and policy advisors of an economy believe that the full employment GDP is $7500 billion, and Pe, the overall expected price level is 118. In addition, the researchers estimate that the short run aggregate supply equation is Y = Ypot + 80 (P - Pe), where Ypot is the potential level of output. In addition, the researchers estimate that the short run aggregate supply equation is Y = Ypot + 80 (P- Pe), where Ypot is the potential level of output. In 2016, the population was 400 million, and the structure of the economy was described by the following equations for household consumption behavior and taxes received: C = 100+ 0.8DI, and T = 0.25Y where all monetary values are in billions of dollars. Government spending was fixed at $1700 billion, and firm's investment behavior was fixed at $800 billion. Trading is allowed in this economy and in 2016, trading occurred such that the trade account was balanced.…arrow_forward
- Raphael receives a portion of his income from his holdings of interest-bearing U.S. government bonds. The bonds offer a real interest rate of 2.5% per year. The nominal interest rate on the bonds adjusts automatically to account for the inflation rate. The government taxes nominal interest income at a rate of 10%. The following table shows two scenarios: a low-inflation scenario and a high-inflation scenario. Given the real interest rate of 2.5% per year, find the nominal interest rate on Raphael's bonds, the after-tax nominal interest rate, and the after-tax real interest rate under each inflation scenario. Inflation Rate (Percent) Real Interest Rate (percent) Nominal Interest Rate (Percent) After-Tax Nominal Interest Rate (Percent) After-Tax Real Interest Rate (percent) 2.0 2.5 7.5 2.5arrow_forwardQ1: Consider the AS-AD model. Suppose the economy of Economica is initially at the general equilibrium. Suppose the central bank increases the nominal money supply by 10%. a). Explain and show graphically how an increase in the nominal money supply affects the labor, goods, or asset market. b). Explain and show graphically how an increase in the nominal money supply affect the short-run equilibrium in the AS-AD model. c). Explain and show graphically how an increase in the nominal money supply affect the general (long-run) equilibrium in the AS-AD model.arrow_forwardAntonio receives a portion of his income from his holdings of interest-bearing U.S. government bonds. The bonds offer a real interest rate of 4.5% per year. The nominal interest rate on the bonds adjusts automatically to account for the inflation rate. The government taxes nominal interest income at a rate of 10%. The following table shows two scenarios: a low-inflation scenario and a high-inflation scenario. Given the real interest rate of 4.5% per year, find the nominal interest rate on Antonio's bonds, the after-tax nominal interest rate, and the after-tax real interest rate under each inflation scenario. Inflation Rate (Percent) After-Tax Nominal Interest Rate (Percent) Real Interest Rate Nominal Interest Rate After-Tax Real Interest Rate (Percent) (Percent) (Percent) 2.0 4.5 4.5 9.5 Compared with lower inflation rates, a higher inflation rate will quantity of investment in the economy and the after-tax real interest rate when the government taxes nominal interest income. This…arrow_forward
- C = 100 + 0.5 - (Y – T) I = 200 – 1000 - r where Y is real output and r is the real interest rate. Government purchases and taxes are G= 300, Ť= 200. The LM (money market equilibrium) curve is M Y 10i where P is the price level and i is the nominal interest rate. The Central Bank (CB) is initially supplying M = 2000 units of money, and expected inflation is a“ = 0.02. Assume that the long-run equilibrium level of output is Y = 1000. Short-run equilibrium output is initially at the same level (Y = 1000). Suddenly, news of a new world-beating super-vaccine raises the investment function to I = 250 – 1000 -r Question 1 Derive the long-run equilibrium values of output Y, consumption C, private and public savings Sprivate and Spublie, investment I, the real and nominal interest rates (r, i) and price P, before and after the vaccine news shock. In particular: 1. Explain how the long-run values of (r, i) are determined before the vaccine news shock. 2. Which, if any, of the graphs from…arrow_forwardAn economy's aggregate demand curve (the relationship between short-run equilibrium output and inflation) is described by the equation:Y = 15,000 - 12,000π, where π is the inflation rate. Initially, the inflation rate is 2 percent or π = 0.02. Potential output Yp equals 14,640.Note: Keep as much precision as possible during your calculations. Your final answer for inflation should be accurate to at least two decimal places and output should be accurate to the nearest whole number.a) Find inflation and output in short-run equilibrium. Inflation : 0%Output : $0 b) Find inflation and output in long-run equilibrium. Inflation : 0%Output : $0arrow_forwardC = 100 + 0.5 · (Y – T) I = 500 – 1000 - r where Y is real output and r is the real interest rate. Government purchases and taxes are Ğ = 500, T = 100. The LM (money market equilibrium) curve is MY P 5i where P is the price level and i is the nominal interest rate. The Central Bank (CB) is initially supplying M = 8000 units of money, and expected inflation is a = 0. Assume that the long-run equilibrium level of output is Y = 2000. Short-run equilibrium output is initially at the same level (Y = 2000). Suddenly, news of a new world-beating super-vaccine raises expected inflation to = 0.05. 1. Suppose the government (not the CB) wants to stabilise the shock in the short-run. Explain whether it should increase the government deficit (AĞ > AT) or reduce it (AĞ < AT), and how it works. 2. Now suppose the government doesn't do anything, and the CB wants to stabilise the shock in the short-run. Explain whether it should decrease or increase money supply M if it wants to bring output Y back to…arrow_forward

 Principles of Economics (12th Edition)EconomicsISBN:9780134078779Author:Karl E. Case, Ray C. Fair, Sharon E. OsterPublisher:PEARSON
 Engineering Economy (17th Edition)EconomicsISBN:9780134870069Author:William G. Sullivan, Elin M. Wicks, C. Patrick KoellingPublisher:PEARSON
 Principles of Economics (MindTap Course List)EconomicsISBN:9781305585126Author:N. Gregory MankiwPublisher:Cengage Learning
 Managerial Economics: A Problem Solving ApproachEconomicsISBN:9781337106665Author:Luke M. Froeb, Brian T. McCann, Michael R. Ward, Mike ShorPublisher:Cengage Learning
 Managerial Economics & Business Strategy (Mcgraw-...EconomicsISBN:9781259290619Author:Michael Baye, Jeff PrincePublisher:McGraw-Hill Education