
Concept explainers
Videos
To make the box whisker plot of the data of students attending the school in the country and discuss the variability of data.
Explanation of Solution
Consider the following data set of students attending the schools are given by table-
| School Name | Number of Students |
| School 1 | 87 |
| School 2 | 52 |
| School 3 | 91 |
| School 4 | 66 |
| School 5 | 79 |
| School 6 | 56 |
| School 7 | 73 |
| School 8 | 90 |
| School 9 | 78 |
| School 10 | 51 |
| School 11 | 83 |
The given data set is
Now, let us make the following box-whisker plot of the data set as follows-
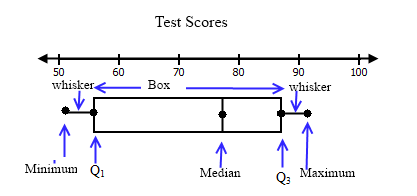
The variability of data set is as follows-
Minimum:
Chapter 14 Solutions
Advanced Mathematical Concepts: Precalculus with Applications, Student Edition
Additional Math Textbook Solutions
Precalculus (10th Edition)
University Calculus: Early Transcendentals (3rd Edition)
Single Variable Calculus: Early Transcendentals (2nd Edition) - Standalone book
Calculus: Early Transcendentals (3rd Edition)
University Calculus: Early Transcendentals (4th Edition)


 Calculus: Early TranscendentalsCalculusISBN:9781285741550Author:James StewartPublisher:Cengage Learning
 Thomas' Calculus (14th Edition)CalculusISBN:9780134438986Author:Joel R. Hass, Christopher E. Heil, Maurice D. WeirPublisher:PEARSON
 Calculus: Early Transcendentals (3rd Edition)CalculusISBN:9780134763644Author:William L. Briggs, Lyle Cochran, Bernard Gillett, Eric SchulzPublisher:PEARSON
 Calculus: Early TranscendentalsCalculusISBN:9781319050740Author:Jon Rogawski, Colin Adams, Robert FranzosaPublisher:W. H. Freeman
 Calculus: Early Transcendental FunctionsCalculusISBN:9781337552516Author:Ron Larson, Bruce H. EdwardsPublisher:Cengage Learning