
Statistics for Engineers and Scientists
4th Edition
ISBN: 9780073401331
Author: William Navidi Prof.
Publisher: McGraw-Hill Education
expand_more
expand_more
format_list_bulleted
Videos
Textbook Question
Chapter 1.3, Problem 5E
A certain reaction was run several times using each of two catalysts, A and B. The catalysts were supposed to control the yield of an undesirable side product. Results, in units of percentage yield, for 24 runs of catalyst A and 20 runs of catalyst B are as follows:
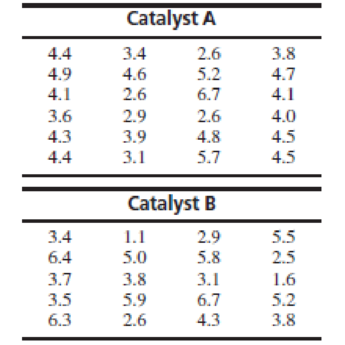
- a. Construct a histogram for the yields of each catalyst.
- b. Construct comparative boxplots for the yields of the two catalysts.
- c. Using the boxplots, what differences can be seen between the results of the yields of the two catalysts?
Expert Solution & Answer
Want to see the full answer?
Check out a sample textbook solution
Students have asked these similar questions
The quantity of dissolved oxygen is a measure of water pollution in lakes, rivers, and streams. Water samples were taken at four different locations in a river in an effort to determine if water pollution varied from location to location. Location I was 500 meters above an industrial plant water discharge point and near the shore. Location II was 200 meters above the discharge point and in midstream. Location III was 50 meters downstream from the discharge point and near the shore. Location IV was 200 meters downstream from the discharge point and in midstream. The following table shows the results. Lower dissolved oxygen readings mean more pollution. Because of the difficulty in getting midstream samples, ecology students collecting the data had fewer of these samples. Use a 5% level of significance. Do we reject or not reject the claim that the quantity of dissolved oxygen does not vary from one location to another?
Location I
Location II
Location III
Location IV
7.6
6.3
4.6…
The quantity of dissolved oxygen is a measure of water pollution in lakes, rivers, and streams. Water samples were taken at four different locations in a river in an effort to determine if water pollution varied from location to location. Location I was 500 meters above an industrial plant water discharge point and near the shore. Location II was 200 meters above the discharge point and in midstream. Location III was 50 meters downstream from the discharge point and near the shore. Location IV was 200 meters downstream from the discharge point and in midstream. The following table shows the results. Lower dissolved oxygen readings mean more pollution. Because of the difficulty in getting midstream samples, ecology students collecting the data had fewer of these samples. Use a 5% level of significance. Do we reject or not reject the claim that the quantity of dissolved oxygen does not vary from one location to another?
Location I
Location II
Location III
Location IV
7.1
6.6
4.6…
The quantity of dissolved oxygen is a measure of water pollution in lakes, rivers, and streams. Water samples were taken at four different locations in a river in an effort to determine if water pollution varied from location to location. Location I was 500 meters above an industrial plant water discharge point and near the shore. Location II was 200 meters above the discharge point and in midstream. Location III was 50 meters downstream from the discharge point and near the shore. Location IV was 200 meters downstream from the discharge point and in midstream. The following table shows the results. Lower dissolved oxygen readings mean more pollution. Because of the difficulty in getting midstream samples, ecology students collecting the data had fewer of these samples. Use a 1%level of significance. Do we reject or not reject the claim that the quantity of dissolved oxygen does not vary from one location to another?
Location I
Location II
Location III
Location IV
7.6
6.7
4.8
4.9…
Chapter 1 Solutions
Statistics for Engineers and Scientists
Ch. 1.1 - Each of the following processes involves sampling...Ch. 1.1 - If you wanted to estimate the mean height of all...Ch. 1.1 - True or false: a. A simple random sample is...Ch. 1.1 - A sample of 100 college students is selected from...Ch. 1.1 - A certain process for manufacturing integrated...Ch. 1.1 - Refer to Exercise 5. True or false: a. If the...Ch. 1.1 - To determine whether a sample should be treated as...Ch. 1.1 - A medical researcher wants to determine whether...Ch. 1.1 - A medical researcher wants to determine whether...Ch. 1.2 - True or false: For any list of numbers, half of...
Ch. 1.2 - Is the sample mean always the most frequently...Ch. 1.2 - Is the sample mean always equal to one of the...Ch. 1.2 - Is the sample median always equal to one of the...Ch. 1.2 - Find a sample size for which the median will...Ch. 1.2 - For a list of positive numbers, is it possible for...Ch. 1.2 - Is it possible for the standard deviation of a...Ch. 1.2 - In a certain company, every worker received a...Ch. 1.2 - In another company, every worker received a 5%...Ch. 1.2 - A sample of 100 adult women was taken, and each...Ch. 1.2 - In a sample of 20 men, the mean height was 178 cm....Ch. 1.2 - Each of 16 students measured the circumference of...Ch. 1.2 - Refer to Exercise 12. a. If the measurements for...Ch. 1.2 - There are 10 employees in a particular division of...Ch. 1.2 - Quartiles divide a sample into four nearly equal...Ch. 1.2 - In each of the following data sets, tell whether...Ch. 1.3 - The weather in Los Angeles is dry most of the...Ch. 1.3 - Forty-five specimens of a certain type of powder...Ch. 1.3 - Refer to Table 1.2 (in Section 1.2). Construct a...Ch. 1.3 - Following are measurements of soil concentrations...Ch. 1.3 - A certain reaction was run several times using...Ch. 1.3 - Sketch a histogram for which a. The mean is...Ch. 1.3 - The figure below is a histogram showing the...Ch. 1.3 - The histogram below presents the compressive...Ch. 1.3 - Refer to Table 1.4 (in Section 1.3). a. Using the...Ch. 1.3 - Refer to Table 1.5 (in Section 1.3). a. Using the...Ch. 1.3 - The following table presents the number of...Ch. 1.3 - Which of the following statistics cannot be...Ch. 1.3 - A sample of 100 resistors has an average...Ch. 1.3 - Following are boxplots comparing the amount of...Ch. 1.3 - Following are summary statistics for two data...Ch. 1.3 - Match each histogram to the box plot that...Ch. 1.3 - Prob. 17ECh. 1.3 - Match each scatterplot to the statement that best...Ch. 1.3 - Prob. 19ECh. 1 - A vendor converts the weights on the packages she...Ch. 1 - Refer to Exercise 1. The vendor begins using...Ch. 1 - The specification for the pull strength of a wire...Ch. 1 - A coin is tossed twice and comes up heads both...Ch. 1 - The smallest number on a list is changed from 12.9...Ch. 1 - There are 15 numbers on a list, and the smallest...Ch. 1 - There are 15 numbers on a list, and the mean is...Ch. 1 - The article The Selection of Yeast Strains for the...Ch. 1 - Concerning the data represented in the following...Ch. 1 - True or false: In any boxplot, a. The length of...Ch. 1 - For each of the following histograms, determine...Ch. 1 - In the article Occurrence and Distribution of...Ch. 1 - The article Vehicle-Arrival Characteristics at...Ch. 1 - The cumulative frequency and the cumulative...Ch. 1 - The article Hydrogeochemical Characteristics of...Ch. 1 - Water scarcity has traditionally been a major...Ch. 1 - Prob. 18SECh. 1 - The article The Ball-on-Three-Ball Test for...
Knowledge Booster


Learn more about
Need a deep-dive on the concept behind this application? Look no further. Learn more about this topic, statistics and related others by exploring similar questions and additional content below.Similar questions
- The quantity of dissolved oxygen is a measure of water pollution in lakes, rivers, and streams. Water samples were taken at four different locations in a river in an effort to determine if water pollution varied from location to location. Location I was 500 meters above an industrial plant water discharge point and near the shore. Location II was 200 meters above the discharge point and in midstream. Location III was 50 meters downstream from the discharge point and near the shore. Location IV was 200 meters downstream from the discharge point and in midstream. The following table shows the results. Lower dissolved oxygen readings mean more pollution. Because of the difficulty in getting midstream samples, ecology students collecting the data had fewer of these samples. Use a 5% level of significance. Do we reject or not reject the claim that the quantity of dissolved oxygen does not vary from one location to another? Location I Location II Location III Location IV 7.4 6.3 4.5…arrow_forwardThe quantity of dissolved oxygen is a measure of water pollution in lakes, rivers, and streams. Water samples were taken at four different locations in a river in an effort to determine if water pollution varied from location to location. Location I was 500 meters above an industrial plant water discharge point and near the shore. Location II was 200 meters above the discharge point and in midstream. Location III was 50 meters downstream from the discharge point and near the shore. Location IV was 200 meters downstream from the discharge point and in midstream. The following table shows the results. Lower dissolved oxygen readings mean more pollution. Because of the difficulty in getting midstream samples, ecology students collecting the data had fewer of these samples. Use a 10% level of significance. Do we reject or not reject the claim that the quantity of dissolved oxygen does not vary from one location to another? Location I Location II Location III Location IV 7.1 6.6 4.3 4.7 6.7…arrow_forwardPenicillin is produced by the Penicillin fungus, which is grown in a broth whose sugar content must be carefully controlled. Several samples of broth were taken on three successive days, and the amount of dissolved sugars, in milligrams per milliliter, was measured on each sample. The results were as follows. Day 1 : 4.9 5.4 5.3 4.9 5.2 5.1 5.4 4.9 5.1 5.1 4.9 5.4 Day 2 : 5.5 5.2 5.1 5.0 5.3 5.4 5.3 5.2 5.4 5.3 5.4 5.1 Day 3 : 5.8 5.0 5.4 5.5 5.5 5.5 4.8 5.5 5.2 4.9 5.5 5.0 Construct an ANOVA table. Round your answers to four decimal places as needed. One-way ANOVA: Sugar Concentration Source DF SS MS F P Days Error Total Is there enough evidence to conclude that the mean sugar concentration…arrow_forward
- Penicillin is produced by the Penicillin fungus, which is grown in a broth whose sugar content must be carefully controlled. Several samples of broth were taken on three successive days, and the amount of dissolved sugars, in milligrams per milliliter, was measured on each sample. The results were as follows. Day 1 : 4.9 5.4 5.3 4.9 5.2 5.1 5.4 4.9 5.1 5.1 4.9 5.4 Day 2 : 5.5 5.2 5.1 5.0 5.3 5.4 5.3 5.2 5.4 5.3 5.4 5.1 Day 3 : 5.8 5.0 5.4 5.5 5.5 5.5 4.8 5.5 5.2 4.9 5.5 5.0 Construct an ANOVA table. Round your answers to four decimal places as needed. One-way ANOVA: Sugar Concentration Source DF SS MS F P Days Error Totalarrow_forwardThe spotted lanternfly, Lycorma delicatula, is an invasive species to the United States that has the potential to do significant agricultural damage. An ecologist is studying the relationship between the size of the female spotted lanternflies and the number of eggs they produce. The data are summarized below. Length of insect: AVG = 1 inch, SD = 0.15 inchNumber of eggs: AVG = 40 eggs, SD = 5 eggsr = 0.2 Using regression, we can say that the average number of eggs produced by female spotted lanternflies who are 1.1 inch long is closest to... Group of answer choices 42 39 40 41arrow_forwardFour laboratories are being used to perform chemical analysis. Samples of the same material are sent to the laboratories for analysis as part of the study to determine whether or not they give, on the average, the same results. The analytical results for the 4 laboratories are as follows: Laboratory A B D 58.7 62.7 55.9 60.7 61.4 64.5 56.1 60.3 60.9 63.1 57.3 60.9 59.2 60.3 59.1 55.2 61.4 58.2 58.1 62.3 Perform the ANOVA at the 0.05 level of significance and give conclusions concerning the laboratories. The conclusion is a. There is no significant relationship among the average number of chemicals produced by the four laboratories. b. The average number of chemicals produced by the four laboratories are the same. c. There is a significant relationship among the average number of chemicals produced by the four laboratories. d. At least two of average number of chemicals produced by the four laboratories are significantly. Aarrow_forward
- A researcher assessed the effects of a new drug on migraine headaches. One sample of migraine sufferers received a placebo pill (0 milligrams of the drug) every day for a month. A second sample received a 10-mg dose of the drug daily for a month, and a third sample received daily doses of 20-mg. The number of headaches each person had during the month was recorded. The results are summarized in the following table: What is the independent variable (IV)? How many levels do we have for the IV? What is the level of measurement for the IV? What is the DV (remember, the DV is the data)? What is the level of measurement of the DV? What is the best graph to display this data? Explain. Construct a graph (by hand) that incorporates all the information in this table. Looking at your graph, do you think that the new drug treatment really worked. Explain your answer.arrow_forwardRoy ‘s Texaco wants to keep the price of its unleaded gasoline competitive with that of other stations in the area. Roy’s is currently charging $1.29 per gallon. To check that the average price for this gasoline for all stations within a 15 mile radius is higher than his price, Roy randomly samples the price of unleaded gasoline at ten stations located in this area. He obtains the following data for the price per gallon (in dollars): 1.7, 1.5, 2.6, 2.2, 2.4, 2.3, 2.6, 3.0, 1.4, 2.3 Set up the appropriate hypotheses and test them using a significance level of α= .05arrow_forwardRoy's Texaco wants to keep the price of its unleaded gasoline competitive with that of other stations in the area. Roy's is currently charging $1.29 per gallon. To check that the average price for this gasoline for all stations within 12-mile radius is higher than his price, Roy randomly samples the price of unleaded gasoline at ten stations located in this area. He obtains the following data for the price per gallon (in dollars): 1.7, 1.5, 2.6, 2.2, 2.4, 2.3, 2.6, 3.0, 1.4, 2.3 Set up appropriate hypotheses and test them using a significant level of .01.arrow_forward
- Penicillin is produced by the Penicillium fungus, which is grown in a broth whose sugar content must be carefully controlled. Several samples of broth were taken on three successive days, and the amount of dissolved sugars, in milligrams per milliliter, was measured on each sample. The results were as follows. Day 1 : 5.2 5.5 5.1 4.9 5.3 5.0 5.2 5.1 5.4 5.2 4.8 5.1 5.4 Day 2 : 5.8 5.1 5.3 5.5 5.2 4.9 5.4 5.0 5.4 5.0 5.6 5.4 5.6 Day 3 : 5.9 4.9 5.2 5.3 5.1 5.4 5.3 5.8 5.5 5.4 5.4 5.4 5.2 Can you conclude that the mean sugar concentration differs among the three days? Use the =α0.05 level of significance and the ANOVA table shown below. One-way ANOVA: Sugar Concentration Source DF SS MS F P Days 2 0.2851 0.1426 2.3135 0.1134 Error 36 2.2185 0.0616…arrow_forwardA magazine published a study on the ammonia levels near the exit ramp of a highway tunnel. The data in the table below represent daily ammonia concentrations (in parts per million) on eight randomly selected days during the afternoon drive time. Complete parts a through c.arrow_forwardA certain reaction was run several times using each of the two catalysts, A and B. The catalysts were supposed to control the yield of an undesirable side product.Results, in units of percentage yield, for 24 runs of catalyst A and 20 runs of catalyst B are as follows:Catalyst A Catalyst B4.4 3.4 2.6 3.8 3.4 1.1 2.9 5.54.9 4.6 5.2 4.7 6.4 5.0 5.8 2.54.1 2.6 6.7 4.1 3.7 3.8 3.1 1.63.6 2.9 2.6 4.0 3.5 5.9 6.7 5.24.3 3.9 4.8 4.5 6.3 2.6 4.3 3.84.4 3.1 5.7 4.5a. Construct comparative boxplots for the yields of the two catalysts and explain the role the whisker plays in data analysis. b. Interpret what the box plot for catalyst B, communicate in real life? marc. In your own words, give a simple explanation on why statisticians think the sample variance is biased estimator of the population variance and how it could be corrected.arrow_forward
arrow_back_ios
SEE MORE QUESTIONS
arrow_forward_ios
Recommended textbooks for you
 MATLAB: An Introduction with ApplicationsStatisticsISBN:9781119256830Author:Amos GilatPublisher:John Wiley & Sons Inc
 Probability and Statistics for Engineering and th...StatisticsISBN:9781305251809Author:Jay L. DevorePublisher:Cengage Learning
 Statistics for The Behavioral Sciences (MindTap C...StatisticsISBN:9781305504912Author:Frederick J Gravetter, Larry B. WallnauPublisher:Cengage Learning
 Elementary Statistics: Picturing the World (7th E...StatisticsISBN:9780134683416Author:Ron Larson, Betsy FarberPublisher:PEARSON
 The Basic Practice of StatisticsStatisticsISBN:9781319042578Author:David S. Moore, William I. Notz, Michael A. FlignerPublisher:W. H. Freeman
 Introduction to the Practice of StatisticsStatisticsISBN:9781319013387Author:David S. Moore, George P. McCabe, Bruce A. CraigPublisher:W. H. Freeman
MATLAB: An Introduction with Applications
Statistics
ISBN:9781119256830
Author:Amos Gilat
Publisher:John Wiley & Sons Inc
Probability and Statistics for Engineering and th...
Statistics
ISBN:9781305251809
Author:Jay L. Devore
Publisher:Cengage Learning
Statistics for The Behavioral Sciences (MindTap C...
Statistics
ISBN:9781305504912
Author:Frederick J Gravetter, Larry B. Wallnau
Publisher:Cengage Learning
Elementary Statistics: Picturing the World (7th E...
Statistics
ISBN:9780134683416
Author:Ron Larson, Betsy Farber
Publisher:PEARSON
The Basic Practice of Statistics
Statistics
ISBN:9781319042578
Author:David S. Moore, William I. Notz, Michael A. Fligner
Publisher:W. H. Freeman
Introduction to the Practice of Statistics
Statistics
ISBN:9781319013387
Author:David S. Moore, George P. McCabe, Bruce A. Craig
Publisher:W. H. Freeman
Hypothesis Testing using Confidence Interval Approach; Author: BUM2413 Applied Statistics UMP;https://www.youtube.com/watch?v=Hq1l3e9pLyY;License: Standard YouTube License, CC-BY
Hypothesis Testing - Difference of Two Means - Student's -Distribution & Normal Distribution; Author: The Organic Chemistry Tutor;https://www.youtube.com/watch?v=UcZwyzwWU7o;License: Standard Youtube License