
Essentials Of Statistics For Business & Economics
9th Edition
ISBN: 9780357045435
Author: David R. Anderson, Dennis J. Sweeney, Thomas A. Williams, Jeffrey D. Camm, James J. Cochran
Publisher: South-Western College Pub
expand_more
expand_more
format_list_bulleted
Videos
Textbook Question
Chapter 13, Problem 41SE
Late-Night Talk Show Viewership. Jimmy Kimmel Live! on ABC, The Tonight Show Starring Jimmy Fallon on NBC, and The Late Show with Stephen Colbert on CBS are three popular late-night talk shows. The following table shows the number of viewers in millions for a 10-week period during the spring for each of these shows (TV by the Numbers website, https://tvbythenumbers.zap2it.com/).
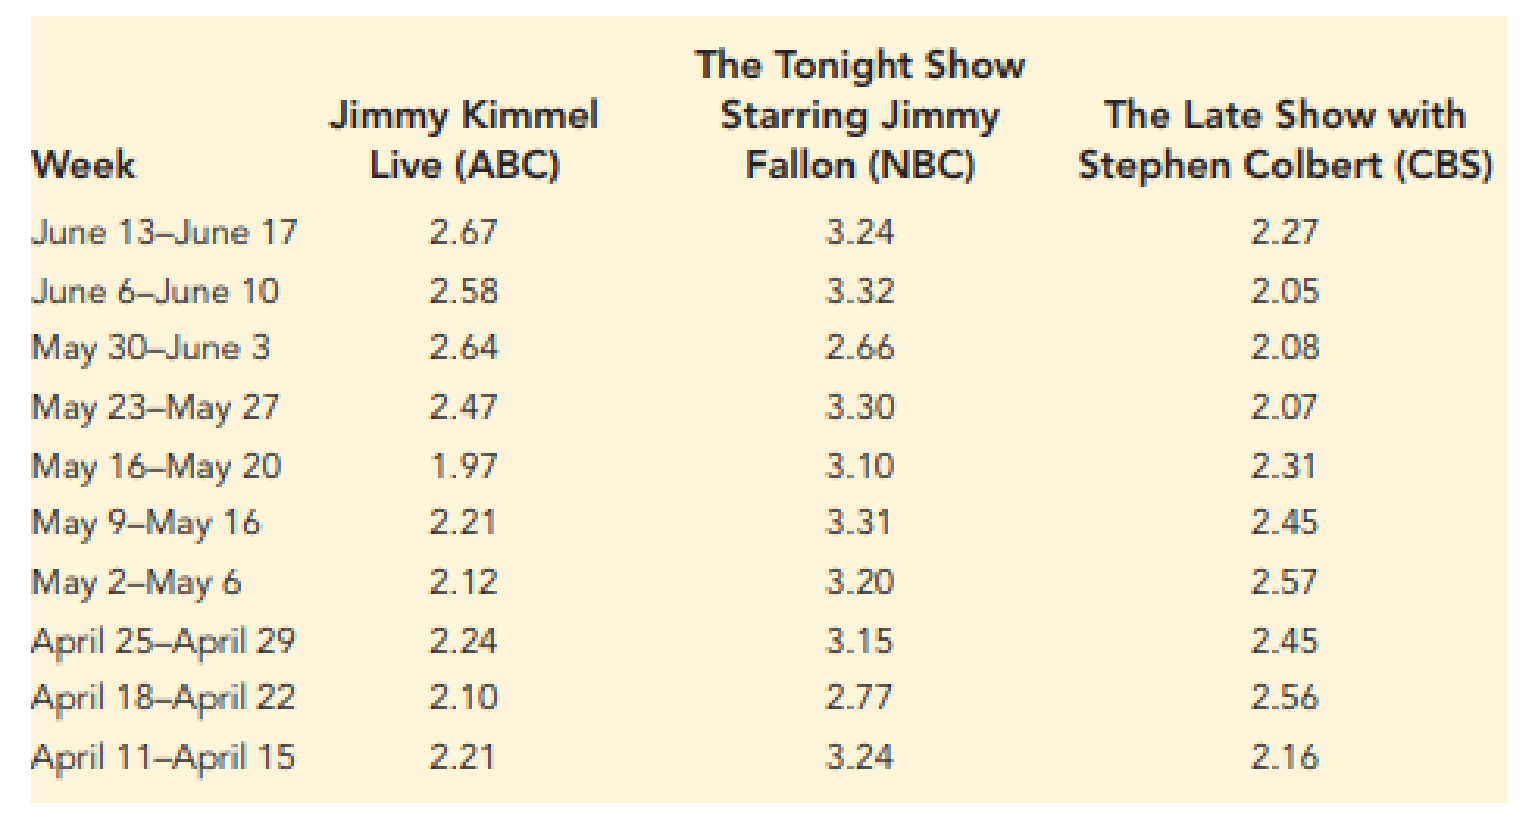
At the .05 level of significance, test for a difference in the mean number of viewers per week for the three late-night talk shows.
Expert Solution & Answer

Trending nowThis is a popular solution!

Students have asked these similar questions
MarkLines is an online portal (www.marklines.com) that reports automotive industry data. The table below shows the number of cars sold in the United States from January to November in 2017 and 2018. The top 22 manufacturers, plus others, are listed here. Sales data often is reported in this way to compare current sales to last year’s sales.
Car Sales
Manufacturer
Jan.-Nov.2017
Jan.-Nov.2018
GM (Est.)
2,691,493
2,654,568
Ford
2,334,290
2,265,590
Toyota
2,211,533
2,205,762
Fiat Chrysler
1,887,430
2,038,684
Honda
1,492,112
1,449,713
Nissan
1,455,238
1,345,157
Hyundai
621,961
612,225
Subaru
584,614
615,594
Kia
546,629
542,245
Mercedes (includes Sprinter)
332,990
318,012
BMW
271,432
276,657
VW
309,395
322,017
Mazda
262,577
274,455
Audi
199,534
200,558
Tesla (Est.)
40,320
106,050
Land Rover
66,759
81,526
Volvo
71828
89437
Mitsubishi
95,185
109,088
Porsche
51,507
53,116
MINI
42,494
40,887
Jaguar
36,180
27,021
Others
18,901
17,251
smart…
TV Viewing Times. Data from a sample of Americans yielded the following estimates of average TV viewing time per month for all Americans 2 years old and older. The times are in hours and minutes; Q1 stands for first quarter. [SOURCE: The Cross-Platform Report, Quarter 1, 2011. Published by The Nielsen Company, _c 2011.]
The Wall Street Journal’s website, www.wsj.com, reported the number of cars and light-duty trucks sold through October of 2014 and October of 2015. The top sixteen manufacturers are listed here. The sales information for all manufacturers can be accessed in a data file below. Sales data are often reported in this way to compare current sales to last year’s sales.
Year-to-Date Sales
Manufacturer
Through October 2015
Through October 2014
General Motors Corp.
2,562,840
2,434,707
Ford Motor Company
2,178,587
2,065,612
Toyota Motor Sales USA Inc.
2,071,446
1,975,368
Chrysler
1,814,268
1,687,313
American Honda Motor Co Inc.
1,320,217
1,281,777
Nissan North America Inc.
1,238,535
1,166,389
Hyundai Motor America
638,195
607,539
Kia Motors America Inc.
526,024
489,711
Subaru of America Inc.
480,331
418,497
Volkswagen of America Inc.
294,602
301,187
Mercedes-Benz
301,915
281,728
BMW of North America Inc.…
Chapter 13 Solutions
Essentials Of Statistics For Business & Economics
Ch. 13.2 - The following data are from a completely...Ch. 13.2 - 2. In a completely randomized design, seven...Ch. 13.2 - 3. Refer to exercise 2.
what hypotheses are...Ch. 13.2 - 4. In an experiment designed to test the output...Ch. 13.2 - 5. In a completely randomized design, 12...Ch. 13.2 - Develop the analysis of variance computations for...Ch. 13.2 - 7. Three different methods for assembling a...Ch. 13.2 - 8. Refer to the NCP data in Table 13.4. Set up the...Ch. 13.2 - To study the effect of temperature on yield in a...Ch. 13.2 - Prob. 10E
Ch. 13.2 - Paint-Drying Robots. How long it takes paint to...Ch. 13.2 - Restaurant Satisfaction. The Consumer Reports...Ch. 13.3 - The following data are from a completely...Ch. 13.3 - The following data are from a completely...Ch. 13.3 - Testing Chemical Processes. To test whether the...Ch. 13.3 - Confidence Intervals for Different Processes....Ch. 13.3 - Marketing Ethics. In the digital age of marketing,...Ch. 13.3 - Machine Breakdowns. To test for any significant...Ch. 13.3 - Testing Time to Breakdown Between All Pairs of...Ch. 13.3 - Minor league Baseball Attendance. The...Ch. 13.4 - Consider the experimental results for the...Ch. 13.4 - Prob. 22ECh. 13.4 - An experiment has been conducted for four...Ch. 13.4 - Auto Tune-Ups. An automobile dealer conducted a...Ch. 13.4 - Airfares on Travel Websites. Are there differences...Ch. 13.4 - SAT Performance. The Scholastic Aptitude Test...Ch. 13.4 - Consumer Preferences. In 2018, consumer goods...Ch. 13.5 - A factorial experiment involving two levels of...Ch. 13.5 - The calculations for a factorial experiment...Ch. 13.5 - Mobile App Website Design. Based on a 2018 study,...Ch. 13.5 - Amusement Park Queues. An amusement park studied...Ch. 13.5 - Auto Fuel Efficiency. As part of a study designed...Ch. 13.5 - Tax Research. A study reported in The Accounting...Ch. 13 - Paper Towel Absorption. In a completely randomized...Ch. 13 - Job Satisfaction. A study reported in the Journal...Ch. 13 - Prob. 36SECh. 13 - College Attendance Rates. The following data show...Ch. 13 - Assembly Methods. Three different assembly methods...Ch. 13 - Job Automation. A Pew Research study conducted in...Ch. 13 - Fuel Efficiency of Gasoline Brands. A research...Ch. 13 - Late-Night Talk Show Viewership. Jimmy Kimmel...Ch. 13 - Golf Club Design. A major manufacturer of golf...Ch. 13 - Language Translation. A factorial experiment was...Ch. 13 - Defective Parts. A manufacturing company designed...Ch. 13 - CASE PROBLEM 1: WENTWORTH MEDICAL CENTER As part...Ch. 13 - CASE PROBLEM 2: COMPENSATION FOR SALES...Ch. 13 - TOURISTOPIA TRAVEL TourisTopia Travel (Triple T)...
Knowledge Booster


Learn more about
Need a deep-dive on the concept behind this application? Look no further. Learn more about this topic, statistics and related others by exploring similar questions and additional content below.Similar questions
- uppose Laura, a facilities manager at a health and wellness company, wants to estimate the difference in the average amount of time that men and women spend at the company's fitness centers each week. Laura randomly selects 13 adult male fitness center members from the membership database and then selects 13 adult female members from the database. Laura gathers data from the past month containing logged time at the fitness center for these members. She plans to use the data to estimate the difference in the time men and women spend per week at the fitness center. The sample statistics are summarized in the table. Population Populationdescription Population mean(unknown) Samplesize Sample mean(min) Sample standarddeviation (min) 1 male ?1 ?1=13 ?⎯⎯⎯1=132.5 ?1=45.3 2 female ?2 ?2=13 ?⎯⎯⎯2=108.7 ?2=31.1 df=21.256 The population standard deviations are unknown and unlikely to be equal, based on the sample data. Laura plans to use the two-sample ?-procedures to estimate the…arrow_forwardPlease help with the last subpart.arrow_forwardBlock: _ Date. Five year-old Susie's parents are concerned that she seems short for her age. Their doctor has the followng rer of Susie' height: Age (months): 20 30 45 50 57 60 Height (cm): 80 86 87 90 91 94 (a) Make a scatterplot of these data:arrow_forward
- This table shows the number of readers of a blog over a number of months.arrow_forwardThe Toyota Camry is one of the best-selling cars in North America. The cost of a previously owned Camry depends on many factors, including the model year, mileage, and condition. To investigate the relationship between the car's mileage and the sales price for Camrys, the following data show the mileage and sale price for 19 sales (PriceHub web site, February 24, 2012). DATA file Miles (1,000s) Price ($1,000s) 22 16.2 29 16.0 36 13.8 47 11.5 63 12.5 77 12.9 73 11.2 87 13.0 92 11.8 101 10.8 110 8.3 28 12.5 59 11.1 68 15.0 68 12.2 91 13.0 42 15.6 65 12.7 110 8.3arrow_forwardForbes magazine published data on the best small firms in 2012. These were firms which had been publicly listed for at least a year, have a stock price of at least $5 per share, and have reported annual revenue between $5 million and $1 billion. Complete the table shows the ages of the chief executive officers for the first 60 ranked firms. What is the frequency for CEO ages between 54 and 65?arrow_forward
arrow_back_ios
arrow_forward_ios
Recommended textbooks for you
 Glencoe Algebra 1, Student Edition, 9780079039897...AlgebraISBN:9780079039897Author:CarterPublisher:McGraw Hill
 Big Ideas Math A Bridge To Success Algebra 1: Stu...AlgebraISBN:9781680331141Author:HOUGHTON MIFFLIN HARCOURTPublisher:Houghton Mifflin Harcourt
 Holt Mcdougal Larson Pre-algebra: Student Edition...AlgebraISBN:9780547587776Author:HOLT MCDOUGALPublisher:HOLT MCDOUGAL
 Algebra: Structure And Method, Book 1AlgebraISBN:9780395977224Author:Richard G. Brown, Mary P. Dolciani, Robert H. Sorgenfrey, William L. ColePublisher:McDougal Littell
Glencoe Algebra 1, Student Edition, 9780079039897...
Algebra
ISBN:9780079039897
Author:Carter
Publisher:McGraw Hill
Big Ideas Math A Bridge To Success Algebra 1: Stu...
Algebra
ISBN:9781680331141
Author:HOUGHTON MIFFLIN HARCOURT
Publisher:Houghton Mifflin Harcourt
Holt Mcdougal Larson Pre-algebra: Student Edition...
Algebra
ISBN:9780547587776
Author:HOLT MCDOUGAL
Publisher:HOLT MCDOUGAL
Algebra: Structure And Method, Book 1
Algebra
ISBN:9780395977224
Author:Richard G. Brown, Mary P. Dolciani, Robert H. Sorgenfrey, William L. Cole
Publisher:McDougal Littell
What Are Research Ethics?; Author: HighSchoolScience101;https://www.youtube.com/watch?v=nX4c3V23DZI;License: Standard YouTube License, CC-BY
What is Ethics in Research - ethics in research (research ethics); Author: Chee-Onn Leong;https://www.youtube.com/watch?v=W8Vk0sXtMGU;License: Standard YouTube License, CC-BY