
Videos
The Corruption Perceptions Index uses perceptions of the general public. business people, and risk analysts to rate countries by how likely they are to accept bribes the ratings are on a scale from 0 to 10, where higher scores represent less corruption, the graph shows the corruption rating for the world's least corrupt and most corrupt countries (The ruling for the United States is' 7.6.) Use the graph to solve Exercises 99-100.
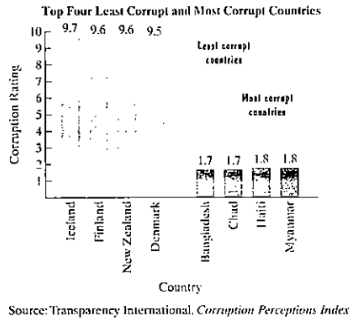
a. Write a set or four ordered pairs in which each of the least corrupt countries corresponds to a corruption rating. Each ordered pair should be in the form
(country, corruption rating).
b. Is the relation in part (a) a function? Explain your answer.
c. Write a set of four ordered pairs in which corruption ratings for the least corrupt countries correspond to countries- Each ordered pair should be in the form (corruption rating, country).
d. Is the relation in part (c) a function? Explain your answer.

Trending nowThis is a popular solution!

Chapter 1 Solutions
Precalculus (6th Edition)


- Running In 1987, Canadian Ben Johnson set a world record in the 100-m sprint.The record was later taken away when he was found to have used an anabolic steroid to enhance his performance. His speed at various times in the race is given in the following table . Source: Information Graphics. Timesec Speedmph 0 0 1.84 12.9 3.80 23.8 6.38 26.3 7.23 26.3 8.96 26.0 9.83 25.7 a. Use the information in the table and left endpoints to estimate the distance that Johnson ran in miles. You will first need to calculate t for each interval. At the end, you will need to divide by 3600 the number of seconds in an hour, since the speed is in miles per hour. b. Repeat part a, using right endpoints. c. Wait a minute, we know that the distance Johnson ran is 100m. Divide this by 1609, the number of meters in a mile, to find how far Johnson ran in miles. Is your answer from part a or part b closer to the true answer? Briefly explain why you think this answer should be more accurate. d.arrow_forwardIn Exercises 49-52, use the bar graph, which shows the receipts of the federal government (in billions of dollars) for selected years from 2008 through 2014. In each exercise, you are given the expenditures of the federal government. Find the magnitude of the surplus or deficit for the year. YearReceipts, R Expenditures, E | RE | 2012$3537.0billionarrow_forward
 Glencoe Algebra 1, Student Edition, 9780079039897...AlgebraISBN:9780079039897Author:CarterPublisher:McGraw Hill
 Calculus For The Life SciencesCalculusISBN:9780321964038Author:GREENWELL, Raymond N., RITCHEY, Nathan P., Lial, Margaret L.Publisher:Pearson Addison Wesley,
 Trigonometry (MindTap Course List)TrigonometryISBN:9781337278461Author:Ron LarsonPublisher:Cengage Learning
 Algebra: Structure And Method, Book 1AlgebraISBN:9780395977224Author:Richard G. Brown, Mary P. Dolciani, Robert H. Sorgenfrey, William L. ColePublisher:McDougal Littell
 Big Ideas Math A Bridge To Success Algebra 1: Stu...AlgebraISBN:9781680331141Author:HOUGHTON MIFFLIN HARCOURTPublisher:Houghton Mifflin Harcourt
 Holt Mcdougal Larson Pre-algebra: Student Edition...AlgebraISBN:9780547587776Author:HOLT MCDOUGALPublisher:HOLT MCDOUGAL