
Concept explainers
Videos
(a)
The intercepts of the red line graphically, and interpret the meaning of each intercept.
The
Explanation:
Consider the linear model.
For subsidy,
Here,
For total income,
The provided graph is:
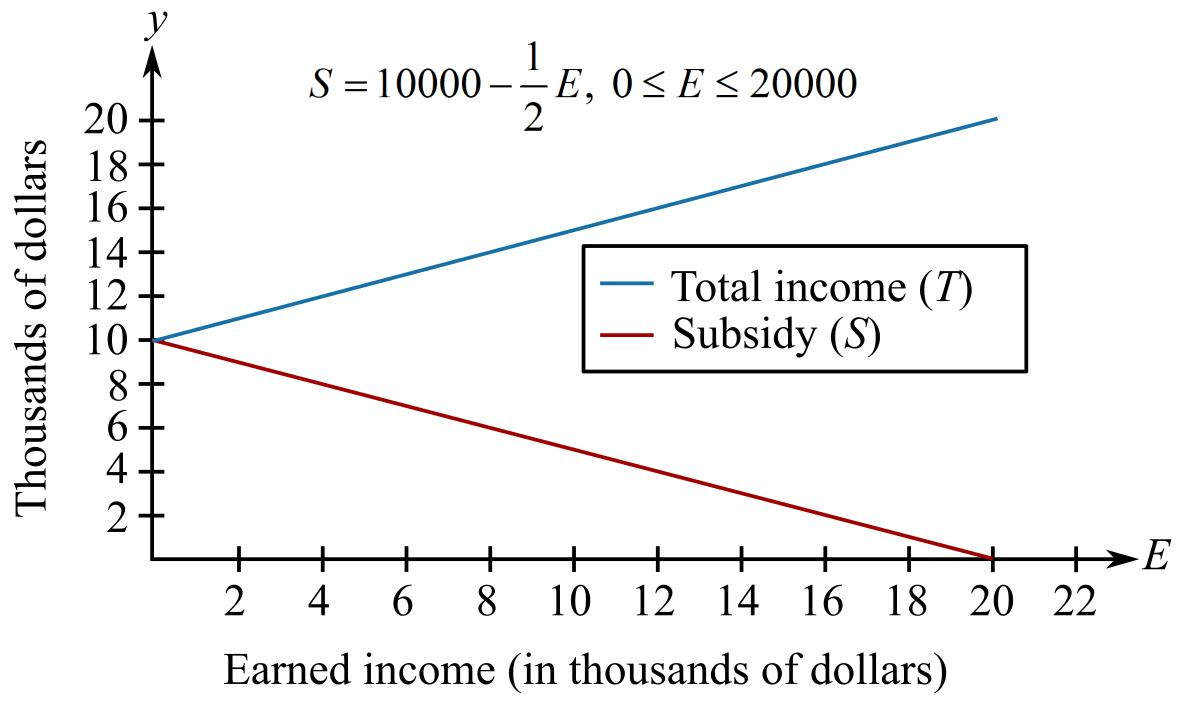
By observing the graph, it can be estimated that the red line cuts the
The
Hence, the
(b)
To calculate: The intercepts of the red line algebraically.
The
Calculation:
Consider the provided graph.
The red line represents,
Upon substituting
Thus, the
Now, substitute
Thus, the
Hence, the
(c)
The earned income for which the total income is
The earned income for which the total income is
Explanation:
Consider the provided graph.
The blue line represents the Total Income,
Observe the graph below.

Hence, the earned income for which the total income is
(d)
To calculate: The earned income when the total income is
The earned income for which the total income is
Calculation:
Consider the linear model for total income,
Substitute
Check:
Substitute
Thus, it is true.
Hence, the earned income for which the total income is
Want to see the full answer?
Check out a sample textbook solution
Chapter 1 Solutions
College Algebra


 Glencoe Algebra 1, Student Edition, 9780079039897...AlgebraISBN:9780079039897Author:CarterPublisher:McGraw Hill
 Algebra & Trigonometry with Analytic GeometryAlgebraISBN:9781133382119Author:SwokowskiPublisher:Cengage
 Trigonometry (MindTap Course List)TrigonometryISBN:9781337278461Author:Ron LarsonPublisher:Cengage Learning
 Intermediate AlgebraAlgebraISBN:9781285195728Author:Jerome E. Kaufmann, Karen L. SchwittersPublisher:Cengage Learning
 Algebra for College StudentsAlgebraISBN:9781285195780Author:Jerome E. Kaufmann, Karen L. SchwittersPublisher:Cengage Learning