
Probability and Statistics for Engineering and the Sciences
9th Edition
ISBN: 9781305251809
Author: Jay L. Devore
Publisher: Cengage Learning
expand_more
expand_more
format_list_bulleted
Videos
Textbook Question
Chapter 1.2, Problem 24E
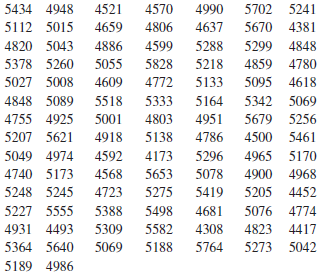
The accompanying data set consists of observations on shear strength (lb) of ultrasonic spot welds made on a certain type of alclad sheet. Construct a relative frequency histogram based on ten equal-width classes with boundaries 4000. 4200 [The histogram will agree with the one in “Comparison of Properties of Joints Prepared by Ultrasonic Welding and Other Means” [j. of Aircraft. 1983: 552-556).] Comment on its features.
Expert Solution & Answer

Trending nowThis is a popular solution!

Students have asked these similar questions
The article "Electrical Impedance Variation with Water Saturation in Rock" (Q. Su, Q.
Feng, and Z. Shang, Geophysics, 2000:68–75) reports measurements of permeabilities (in
10-3um?), porosities (in percent), and surface area per unit volume of pore space (in 104 cm
-1) for several rock samples. The results are presented in the following table, denoting In
Permeability by y, porosity by x1, and surface area per unit volume by x2.
y
-0.27
х,
19.83
X2
9.55
2.58
17.93
10.97
3.18
21.27
31.02
1.70
18.67
28.12
-1.17
7.98
52.35
-0.27
10.16
32.82
17.86
13.48
-0.53
57.66
-0.29
21.10
4.94
17.49
9.15
1.94
14.18
11.72
3.74
23.88
5.43
0.58
10.52
20.03
-0.56
18.92
13.10
-0.49
18.55
12.78
-0.01
13.72
40.28
-1.71
9.12
53.67
14.39
11.38
-0.12
26.75
-0.92
75.62
2.18
16.59
9.95
4.46
16.77
7.88
2.11
18.55
88.10
-0.04
18.02
10.95
Fit the model y = 6, + B,X1 + B>x2 + B3x;xX2 + ɛ. Compute the analysis of variance table.
a.
b. Fit the model y = Bo + B;X1 + B2X2 + ɛ. Compute the analysis of variance table.
c.…
Following are measurements of soil concentrations (in mg /kg) of chromium (Cr) and nickel (Ni) at20 sites in the area of Cleveland, Ohio. These data are taken from the article "Variation in NorthAmerican Regulatory Guidance for Heavy Metal Surface Soil Contamination at Commercial andIndustrial Sites" (A. Jennings and J. Ma, J. Environment Eng, 2007:587-609).
Cr: 260 19 36 247 263 319 317 277 319 264 23 29 61 119 33 281 21 35 64 30Ni: 435 377 359 53 38 38 54 188 397 33 92 490 28 35 799 347 321 32 74 508
(a) Construct a histogram for each set of concentrations.
(b) Find the 1st, 2nd and 3rd quartiles for the Cr concentrations
(c) Find the 1st, 2nd and 3rd quartiles for the Ni concentrations.
Following are measurements of soil concentrations (in mg /kg) of chromium (Cr) and nickel (Ni) at20 sites in the area of Cleveland, Ohio. These data are taken from the article "Variation in NorthAmerican Regulatory Guidance for Heavy Metal Surface Soil Contamination at Commercial andIndustrial Sites" (A. Jennings and J. Ma, J. Environment Eng, 2007:587-609).Cr: 260 19 36 247 263 319 317 277 319 264 23 29 61 119 33 281 21 35 64 30Ni: 435 377 359 53 38 38 54 188 397 33 92 490 28 35 799 347 321 32 74 508
(d) Use these to construct comparative boxplots for the two sets of concentrations.
(e) Using the boxplots, what differences can be seen between the two sets of concentrations?
Chapter 1 Solutions
Probability and Statistics for Engineering and the Sciences
Ch. 1.1 - Give one possible sample of size 4 from each of...Ch. 1.1 - For each of the following hypothetical...Ch. 1.1 - Consider the population consisting of all...Ch. 1.1 - a. Give three different examples of concrete...Ch. 1.1 - Many universities and colleges have instituted...Ch. 1.1 - The California State University (CSU) system...Ch. 1.1 - A certain city divides naturally into ten district...Ch. 1.1 - The amount of flow through a solenoid valve in an...Ch. 1.1 - In a famous experiment carried out in 1882,...Ch. 1.2 - Consider the strength data for beams given in...
Ch. 1.2 - The accompanying specific gravity values for...Ch. 1.2 - The accompanying summary data on CeO2 particle...Ch. 1.2 - Allowable mechanical properties for structural...Ch. 1.2 - The accompanying data set consists of observations...Ch. 1.2 - Do running limes of American movies differ somehow...Ch. 1.2 - The article cited in Example 1.2 also gave the...Ch. 1.2 - The accompanying data came from a study of...Ch. 1.2 - Every corporation has a governing board of...Ch. 1.2 - The number of contaminating particles on a silicon...Ch. 1.2 - The article Determination of Most Representative...Ch. 1.2 - The article cited in Exercise 20 also gave the...Ch. 1.2 - How does the speed of a runner vary over the...Ch. 1.2 - The article Statistical Modeling of the Time...Ch. 1.2 - The accompanying data set consists of observations...Ch. 1.2 - A transformation of data values by means of some...Ch. 1.2 - The accompanying summary data on CeO2 particle...Ch. 1.2 - The article Study on the Life Distribution of...Ch. 1.2 - The accompanying frequency distribution on...Ch. 1.2 - The following categories for type of physical...Ch. 1.2 - A Pareto diagram is a variation of a histogram for...Ch. 1.2 - The cumulative frequency and cumulative relative...Ch. 1.2 - Fire load (MJ/m2) is the heat energy that could be...Ch. 1.3 - The May 1, 2009, issue of The Montclarian reported...Ch. 1.3 - Exposure to microbial products, especially...Ch. 1.3 - Mercury is a persistent and dispersive...Ch. 1.3 - A sample of 26 offshore oil workers took part in a...Ch. 1.3 - The article Snow Cover and Temperature...Ch. 1.3 - Blood pressure values are often reported to the...Ch. 1.3 - The propagation of fatigue cracks in various...Ch. 1.3 - Compute the sample median. 25% trimmed mean. 10%...Ch. 1.3 - A sample of n = 10 automobiles was selected, and...Ch. 1.3 - a. If a constant c is added to each xi in a...Ch. 1.3 - An experiment to study the lifetime (in hours) for...Ch. 1.4 - Poly(3-hydroxybutyrate) (PHB), a semicrystalline...Ch. 1.4 - The value of Youngs modulus (GPa) was determined...Ch. 1.4 - The article Effects of Short-Term Warming on Low...Ch. 1.4 - Zinfandel is a popular red wine varietal produced...Ch. 1.4 - Exercise 34 presented the following data on...Ch. 1.4 - A study of the relationship between age and...Ch. 1.4 - In 1997 a woman sued a computer keyboard...Ch. 1.4 - The article A Thin-Film Oxygen Uptake Test for the...Ch. 1.4 - The first four deviations from the mean in a...Ch. 1.4 - A mutual fund is a professionally managed...Ch. 1.4 - Grip is applied to produce normal surface forces...Ch. 1.4 - Here is a stem-and-leaf display of the escape time...Ch. 1.4 - The following data on distilled alcohol content...Ch. 1.4 - A sample of 20 glass bottles of a particular type...Ch. 1.4 - A company utilizes two different machines to...Ch. 1.4 - Blood cocaine concentration (mg/L) was determined...Ch. 1.4 - Observations on burst strength (lb/in2) were...Ch. 1.4 - The accompanying comparative boxplot of gasoline...Ch. 1 - Consider the following information on ultimate...Ch. 1 - A sample of 77 individuals working at a particular...Ch. 1 - Fretting is a wear process that results from...Ch. 1 - The accompanying frequency distribution of...Ch. 1 - A deficiency of the (race element selenium in the...Ch. 1 - Aortic stenosis refers to a narrowing of the...Ch. 1 - a. For what value of c is the quantity (xi c)2...Ch. 1 - a. Let a and b be constants and let yi = axi + b...Ch. 1 - Elevated energy consumption during exercise...Ch. 1 - Here is a description from Minitab of the strength...Ch. 1 - Anxiety disorders and symptoms can often be...Ch. 1 - The article Can We Really Walk Straight? (Amer. J....Ch. 1 - The mode of a numerical data set is the value that...Ch. 1 - Specimens of three different types of rope wire...Ch. 1 - The three measures of center introduced in this...Ch. 1 - The authors of the article Predictive Model for...Ch. 1 - Consider a sample x1 , x2,..., xn and suppose that...Ch. 1 - Let xn and sn2 denote the sample mean and variance...Ch. 1 - Lengths of bus routes for any particular transit...Ch. 1 - A study carried out to investigate the...Ch. 1 - Prob. 82SECh. 1 - Prob. 83SECh. 1 - Consider a sample x1, ... , xn with n even. Let xL...
Knowledge Booster


Learn more about
Need a deep-dive on the concept behind this application? Look no further. Learn more about this topic, statistics and related others by exploring similar questions and additional content below.Similar questions
- The accompanying data set consists of observationson shear strength (lb) of ultrasonic spot welds madeon a certain type of alclad sheet. Construct a relativefrequency histogram based on ten equal-width classeswith boundaries 4000, 4200, …. [The histogram willagree with the one in “Comparison of Properties ofJoints Prepared by Ultrasonic Welding and OtherMeans” (J. of Aircraft, 1983: 552–556).] Commenton its features.5434 4948 4521 4570 4990 5702 52415112 5015 4659 4806 4637 5670 43814820 5043 4886 4599 5288 5299 48485378 5260 5055 5828 5218 4859 47805027 5008 4609 4772 5133 5095 46184848 5089 5518 5333 5164 5342 50694755 4925 5001 4803 4951 5679 52565207 5621 4918 5138 4786 4500 54615049 4974 4592 4173 5296 4965 51704740 5173 4568 5653 5078 4900 49685248 5245 4723 5275 5419 5205 44525227 5555 5388 5498 4681 5076 47744931 4493 5309 5582 4308 4823 44175364 5640 5069 5188 5764 5273 50425189 4986arrow_forwardA study of the properties of metal plate-connected trusses used for roof support yielded the following observations on axial stiffness index (kips/in.) for plate lengths 4, 6, 8, 10, and 12 in: 4: 315.2 409.5 311.0 326.5 316.8 349.8 309.7 6: 405.1 347.2 361.0 404.5 331.0 348.9 381.7 8: 399.4 366.2 351.0 357.1 409.9 367.3 382.0 10: 353.7 452.9 461.4 433.1 410.6 384.2 362.6 12: 417.4 441.8 419.9 410.7 473.4 441.2 465.8 n USE SALT Does variation in plate length have any effect on true average axial stiffness? State the relevant hypotheses using analysis of variance. O Ho: H1# H2 # Hz# H4# H5 H: at least two µ's are equal O Ho: H1 = H2 = H3= H4= H5 H: at least two u's are unequal O Ho: H1 # H2 # Hz# H4# Hs H: all five u's are equal O Ho: H1 = H2 = Hz3 = H4= Hs H: all five u,'s are unequal Test the relevant hypotheses using analysis of variance with a = 0.01. Display your results in an ANOVA table. (Round your answers to two decimal places.) Degrees of freedom Sum of Squares Mean Source…arrow_forwardA study of the properties of metal plate-connected trusses used for roof support yielded the following observations on axial stiffness index (kips/in.) for plate lengths 4, 6, 8, 10, and 12 in: 4: 329.2 409.5 311.0 326.5 316.8 349.8 309.7 6: 425.1 347.2 361.0 404.5 331.0 348.9 381.7 8: 389.4 366.2 351.0 357.1 409.9 367.3 382.0 10: 341.7 452.9 461.4 433.1 410.6 384.2 362.6 12: 414.4 441.8 419.9 410.7 473.4 441.2 465.8 USE SALT Does variation in plate length have any effect on true average axial stiffness? State the relevant hypotheses using analysis of variance. O Ho: M₁ = H₂ = 13 = H4 = 1₂ H₂: all five μ's are unequal O Ho: My H₂ H3 ‡ M4 # M5 H₂: at least two μ's are equal O Ho: My # H₂ H3 # H4 # H5 H₂: all five us are equal = = o Hỏi khi là không = 3 = Mà khô H₂: at least two μ's are unequal Test the relevant hypotheses using analysis of variance with a = 0.01. Display your results in an ANOVA table. (Round your answers to two decimal places.) Sum of Squares Source Treatments Error…arrow_forward
- A study of the properties of metal plate-connected trusses used for roof support yielded the following observations on axial stiffness index (kips/in.) for plate lengths 4, 6, 8, 10, and 12 in: 4: 333.2 409.5 311.0 326.5 316.8 349.8 309.7 6: 433.1 347.2 361.0 404.5 331.0 348.9 381.7 8: 382.4 366.2 351.0 357.1 409.9 367.3 382.0 10: 350.7 452.9 461.4 433.1 410.6 384.2 362.6 12: 413.4 441.8 419.9 410.7 473.4 441.2 465.8 LUSE SALT Does variation in plate length have any effect on true average axial stiffness? State the relevant hypotheses using analysis of variance. O Hoi Hy #fly #Hz" Ha #Hs H: all five μ's are equal O Hoi H₂H₂ = H3 = HaHs H: at least two μ's are unequal O Hoi H₂ = H₂ = H₂ "HaHs H: all five μ's are unequal O Hoi H₂ #4₂ # Hz*H4 *H5 H: at least two μ's are equal Test the relevant hypotheses using analysis of variance with a = 0.01. Display your results in an ANOVA table. (Round your answers to two decimal places.) Degrees of Sum of Mean freedom Squares Squares Error Total…arrow_forwardThe following scatterplot shows the mean annual carbon dioxide (CO,) in parts (CO2) per million (ppm) measured at the top of a mountain and the mean annual air temperature over both land and sea across the globe, in degrees Celsius (C). Complete parts a through h on the right. f) View the accompanying scatterplot of the residuals vs. CO2. Does the scatterplot of the residuals vs. CO, show evidence of the violation of any assumptions behind the regression? 16.800 A. Yes, the outlier condition is violated. 16.725 O B. Yes, the linearity and equal variance assumptions are violated. 16.650 C. Yes, the equal variance assumption is violated. 16.575 O D. No, all assumptioris are okay. 16.500 O E. Yes, all the assumptions are violated. 325.0 337.5 350.0 362.5 CO2 (ppm) OF Yes, the linearity assumption is violated. his vear, What mean temperature doesarrow_forwardA study of the properties of metal plate-connected trusses used for roof support yielded the following observations on axial stiffness index (kips/in.) for plate lengths 4, 6, 8, 10, and 12 in: 4: 321.2 409.5 311.0 326.5 316.8 349.8 309.7 6: 439.1 347.2 361.0 404.5 331.0 348.9 381.7 8: 390.4 366.2 351.0 357.1 409.9 367.3 382.0 10: 362.7 452.9 461.4 433.1 410.6 384.2 362.6 12: 402.4 441.8 419.9 410.7 473.4 441.2 465.8 USE SALT Does variation in plate length have any effect on true average axial stiffness? State the relevant hypotheses using analysis of variance. ○ Ho: H₁ = H₂ = H3 = H4=H5 Ha: all five u's are unequal O Ho: H₁ H₂ H3 H4 H5 Ha: all five μ's are equal Ho H₁ = ₂ = 3 = H4 = 5 H₂: at least two μ's are unequal Ho: H₁ H₂ H3 H4 H5 Ha: at least two μ's are equal Test the relevant hypotheses using analysis of variance with a = 0.01. Display your results in an ANOVA table. (Round your answers to two decimal places.) Mean Degrees of Sum of freedom Squares Squares Source Treatments…arrow_forward
- A study of the properties of metal plate-connected trusses used for roof support yielded the following observations on axial stiffness index (kips/in.) for plate lengths 4, 6, 8, 10, and 12 in: 4: 323.2 409.5 311.0 326.5 316.8 349.8 309.7 6: 423.1 347.2 361.0 404.5 331.0 348.9 381.7 8: 393.4 366.2 351.0 357.1 409.9 367.3 382.0 10: 362.7 452.9 461.4 433.1 410.6 384.2 362.6 12: 418.4 441.8 419.9 410.7 473.4 441.2 465.8 Does variation in plate length have any effect on true average axial stiffness? State the relevant hypotheses using analysis of variance. H0: ?1 ≠ ?2 ≠ ?3 ≠ ?4 ≠ ?5Ha: at least two ?i's are equalH0: ?1 = ?2 = ?3 = ?4 = ?5Ha: all five ?i's are unequal H0: ?1 = ?2 = ?3 = ?4 = ?5Ha: at least two ?i's are unequalH0: ?1 ≠ ?2 ≠ ?3 ≠ ?4 ≠ ?5Ha: all five ?i's are equal Test the relevant hypotheses using analysis of variance with ? = 0.01. Display your results in an ANOVA table. (Round your answers to two decimal places.) Source Degrees offreedom Sum…arrow_forwardThe table below shows the results from the specific gravity (S.G.) test performed in a soil laboratory including twenty samples of sand. Determine the Coefficient of Quartile Variation.arrow_forwardRoman, a health data officer, was tasked to create a report describing the height of all the children ages 12-15 years in a small town in Rome. He measured the height of all the 37 children (ages 12-15 years) in that small town. Answer the table showing the number and percentage of children ages 12 to 15 years according to sex. Sex f Rel f Male <2 decimal places> Female <2 decimal places> Σf <2 decimal places>arrow_forward
- 3. Load the Santa Barbara temperature data using the following com- mands stbarb=read.table ("berkeley.dat")[,3] Since the data is non-stationary, we consider taking difference of stbarb. Create ACF and PACF plots for the differenced data. Do you have an opinion on possible models based only on these plots?arrow_forwardA sample of 20 participants took part in a hearing experiment. Among other things the absolute hearing threshold (in decibels) was measured for each participant. The 20 measurements were as follows. Draw the histogram for these data using an initial class boundary of 16.5, and ending class battery of 41.5 and 5 classes of equal width. Note that you can add or remove classes from the figure label each class with its endpoints.arrow_forwardThe following table contains measurements (in millimeters) of the diameter for a component used in surgeries. Samples of three were taken at approximately one to two hour intervals. Construct the X-bar and Range charts’ control limits (LCL and UCL) for the diameter and answer 4 questions. Observation number Sample 1 2 3 1 7 8 9 2 8 6 8 3 7 8 8 4 8 8 8 1/4) What are the control limits for the X-bar chart? 2/4) What are the control limits for the Range chart? A new sample is obtained with the following measurements (in mm): 6 8 9 3/4) What does the X-bar chart indicate for the new sample? (Cant answer, the process is out of control, or the process is in control?) 4/4) What does the Range chart indicate for the new sample? (Cant answer, the process is out of control, or the process is in control?)arrow_forward
arrow_back_ios
SEE MORE QUESTIONS
arrow_forward_ios
Recommended textbooks for you
 Glencoe Algebra 1, Student Edition, 9780079039897...AlgebraISBN:9780079039897Author:CarterPublisher:McGraw Hill
Glencoe Algebra 1, Student Edition, 9780079039897...
Algebra
ISBN:9780079039897
Author:Carter
Publisher:McGraw Hill
Introduction to experimental design and analysis of variance (ANOVA); Author: Dr. Bharatendra Rai;https://www.youtube.com/watch?v=vSFo1MwLoxU;License: Standard YouTube License, CC-BY