
Videos
The Russian-born U.S. economist and Nobel laureate Wassily Leontief(1906—1999) was interested in the following question: What output should each of the industries in an economy produce to satisfy the total demandfor all products? Here, we consider a very simple example of input—output analysis, an economy with only twoindustries, A and B. Assume that the consumer demandfor their products is, respectively, 1 ,000 and 780, in millions of dollars per year.
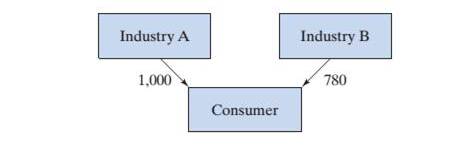
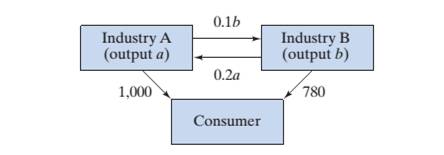
What outputs a andb (in millions of dollars peryear) should the two industries generate to satisfy thedemand? You may be tempted to say 1,000 and 780,respectively, but things are not quite as simple as that.We have to take into account the interindustry demandas well. Let us say that industry A produces electricity.Of course, producing almost any product will requireelectric power. Suppose that industry B needs 10 worthof electricity for each $1 of output B produces and that industry A needs 20 ¢ worth of B’s products for each $1of output A produces. Find the outputs a andb neededto satisfy both consumer and interindustry demand.
Want to see the full answer?
Check out a sample textbook solution
Chapter 1 Solutions
Linear Algebra with Applications (2-Download)


- (a) For United States, provide data for the variables below over the years 1993 –2007:(i) Net migration rate (per 1,000 population)(ii) Total fertility rate (live births per woman)(iii)Unemployment, general level (Thousands)(iv) Wages(v) Life expectancy at birth for both sexes combined (years)Data can be obtained from the UN database http://data.un.org/Explorer.aspxUsing R-Studio, estimate a regression equation to determine the effect of unemployment,general level, wages and life expectancy at birth for both sexes on the net migration rate.(All codes and regression output should be provided).(i) Write down the regression equation. (ii) Interpret the coefficients and determine which of the individual coefficients in theregression model are statistically significant. In responding, construct and test anyappropriate hypothesis. (iii) Interpret the coefficient of determination.arrow_forwardAn investment club has set a goal of earning 15% on the money it invests in stocks. The members are considering purchasing three possible stocks, with their cost per share (in dollars) and their projected growth per share (in dollars) summarized in the following table. (Let x = computer shares, y = utility shares, and z = retail shares.) Stocks Computer (x) Utility (y) Retail (z) Cost/share 30 44 26 Growth/share 6.00 6.00 2.40 (x, y, z) = (a) If they have $392,000 to invest, how many shares of each stock should they buy to meet their goal? (If there are infinitely many solutions, express your answers in terms of z as in Example 3.) (b) If they buy 500 shares of retail stock, how many shares of the other stocks should they buy? What if they buy 1000 shares of retail stock? (c) What is the minimum number of shares of computer stock they should buy? sharesWhat is the number of shares of the other stocks in this case? (d) What is the maximum number of shares of…arrow_forwardTwo sectors of the U.S. economy are (1) audio, video, and communication equipment and (2) electronic components and accessories. Suppose in 1998, the input-output table involving these two sectors was as follows (all figures are in millions of dollars). To Equipment Components From 6,200 600 Components 23,000 32,000 Total Output 90,000 140,000 Determine the production levels (in dollars) necessary in these two sectors to meet an external demand for $78,000 million of communication equipment and $92,000 million of electronic components. Round answers to two significant digits.arrow_forward
- Consumers satisfaction depends only on his income and leisure :arrow_forwardA shoe company forecasts the following demands during the next six months: month 1 – 200; month 2 – 260; month 3 – 240; month 4 – 340; month 5 – 190; month 6 – 150. It costs $7 to produce a pair of shoes with regular-time labor and $11 with overtime labor. During each month, regular production is limited to 200 pairs of shoes, and overtime production is limited to 100 pairs. It costs $1 per month to hold a pair of shoes in inventory. The initial inventory is 0. Let xi = pairs of shoes produced in month i using regular-time labor, yi = pairs of shoes produced in month i using overtime labor, and zi = inventory of shoes at the end of month i. Using these decision variables, formulate an LP that minimizes the total cost and meets the demand on time in the next six months.arrow_forwardExample 12.8. A firm uses milling machines, grinding machines and lathes to pro- duce two motor parts. The machining times required for each part, the machining times avail- able on different machines and the profit on each motor part are given below : Machining time reqd. for the motor part Max. time available per Type of machine (mts) week (minutes) I II 10 2,000 Milling machines Grinding machines Lathes. 2 900 12 3,000 Profit/ unit (Rs.) 100 40 Determine the number of parts I and II to be manufactured per week to maximize the profit. د هarrow_forward
- The cost of producing a particular type of auto- mobile in four different countries is shown in the table below: Number of Fixed cost cars produced Total Variable cost (Ksh. 0,000) Country (Ksh. 0,000) Japan 6. 100 140 India 9. 30 150 China 15 120 330 Germany 12 200 160 Which country has the lowest average cost of productionarrow_forwardThis exercise requires the use of technology.Four sectors of the U.S. economy are (1) livestock and livestock products, (2) other agricultural products, (3) forestry and fishery products, and (4) agricultural, forestry, and fishery services. Suppose that in 1977 the input-output table involving these four sectors was as follows (all figures are in millions of dollars).Determine how these four sectors would react to an increase in demand for livestock (Sector 1) of $2,500 million, how they would react to an increase in demand for other agricultural products (Sector 2) of $2,500 million, and so on. (Round your answers to two decimal places. Let the columns of the matrix be given in millions of dollars.)arrow_forwardThis exercise requires the use of technology. Four sectors of the U.S. economy are (1) livestock and livestock products, (2) other agricultural products, (3) forestry and fishery products, and (4) agricultural, forestry, and fishery services. Suppose that in 1977 the input-output table involving these four sectors was as follows (all figures are in millions of dollars). Determine how these four sectors would react to an increase in demand for livestock (Sector 1) of $3,000 million, how they would react to an increase in demand for other agricultural products (Sector 2) of $3,000 million, and so on. (Round your answers to two decimal places. Let the columns of the matrix be given in millions of dollars.) X X X X To 1 From 1 11,937 2 26,649 3 4 2 9 109 0 0 0 439 5,423 10,952 3,002 Total Output 97,795 120,594 14,642 47,473 3 4,285 4 855 4,744 61 216arrow_forward
- This exercise requires the use of technology. Four sectors of the U.S. economy are (1) livestock and livestock products, (2) other agricultural products, (3) forestry and fishery products, and (4) agricultural, forestry, and fishery services. Suppose that in 1977 the input-output table involving these four sectors was as follows (all figures are in millions of dollars). Determine how these four sectors would react to an increase in demand for livestock (Sector 1) of $1,500 million, how they would react to an increase in demand for other agricultural products (Sector 2) of $1,500 million, and so on. (Round your answers to two decimal places. Let the columns of the matrix be given in millions of dollars.) To 1 2 3 4 From 1 11,937 9 109 855 2 26,649 4,285 4,744 439 61 4 5,423 10,952 3,002 216 Total Output 97,795 120,594 14,642 47,473arrow_forwardThis exercise requires the use of technology. Four sectors of the U.S. economy are (1) livestock and livestock products, (2) other agricultural products, (3) forestry and fishery products, and (4) agricultural, forestry, and fishery services. Suppose that in 1977 the input-output table involving these four sectors was as follows (all figures are in millions of dollars). Determine how these four sectors would react to an increase in demand for livestock (Sector 1) of $2,500 million, how they would react to an increase in demand for other agricultural products (Sector 2) of $2,500 million, and so on. (Round your answers to two decimal places. Let the columns of the matrix be given in millions of dollars.) 2850 7.75 X 32.5 X 52.5 X X X X 2550 1225 0.37 275 X X Need Help? 3975 0.38 375 From X Practice It To 1 100 2577.5 550 1 11,937 2 26,649 3 4 2 0 9 109 0 439 855 4,744 61 5,423 10,952 3,002 216 Total Output 97,795 120,594 14,642 47,473 4,285 3 0 420 3.5 4 X X X Xarrow_forwardThe table shows the total personal income in a country (in billions of dollars) for selected years from 1960 and projected to 2024. Complete parts (a) and (b) below. …. Year 1960 1970 1980 y=(x²+x+ (Type integers or decimals rounded to three decimal places as needed.) 1990 2000 Income ($ billions) Year 411.7 2008 838.6 2014 2307.9 2018 4878.7 2024 22685.5 8429.9 Income ($ billions) 12100.8 14728.6 19129.7 a. These data can be modeled by a quadratic function. Write the equation of this function, with x equal to the number of years after 1960. b. In what year does the model predict the total personal income will reach $24.772 trillion? The unrounded model predicts the total personal income will reach $24.772 trillion inarrow_forward
 Linear Algebra: A Modern IntroductionAlgebraISBN:9781285463247Author:David PoolePublisher:Cengage Learning