Compute the following profitability ratios of the company for the most recent two years, show all values in the computations: 1.Asset Turnover 2.Profit margin ratio(Net Income/Net Sales) 3.Return on total assets (Net Income/Average Total Assets) 4.Return on stockholders’ equity 5.Basic Earnings per share (EPS) Based on the results above, what conclusions can you make about the company’s overall profitability and efficient use of assets?
Compute the following profitability ratios of the company for the most recent two years, show all values in the computations: 1.Asset Turnover 2.Profit margin ratio(Net Income/Net Sales) 3.Return on total assets (Net Income/Average Total Assets) 4.Return on stockholders’ equity 5.Basic Earnings per share (EPS) Based on the results above, what conclusions can you make about the company’s overall profitability and efficient use of assets?

Chapter1: Financial Statements And Business Decisions
Section: Chapter Questions
Problem 1Q

Related questions
Question
Compute the following profitability ratios of the company for the
most recent two years, show all values in the computations:
1.Asset Turnover
2.Profit margin ratio(Net Income/Net Sales)
3.Return on total assets (Net Income/Average Total Assets)
4.Return on stockholders’ equity
5.Basic Earnings per share (EPS)
Based on the results above, what conclusions can you make about the company’s overall profitability and efficient use of assets?

Transcribed Image Text:**Balance Sheet Overview (2019 vs. 2018)**
**Assets**
- **Current Assets:**
- Cash and cash equivalents: $19,079 (2019) | $10,019 (2018)
- Marketable securities: $35,776 (2019) | $31,095 (2018)
- Accounts receivable, net: $9,518 (2019) | $7,587 (2018)
- Prepaid expenses and other current assets: $1,852 (2019) | $1,779 (2018)
- Total current assets: $66,225 (2019) | $50,480 (2018)
- **Non-Current Assets:**
- Property and equipment, net: $35,323 (2019) | $24,683 (2018)
- Operating lease right-of-use assets, net: $9,460 (2019)
- Intangible assets, net: $894 (2019) | $1,294 (2018)
- Goodwill: $18,715 (2019) | $18,301 (2018)
- Other assets: $2,759 (2019) | $2,576 (2018)
- Total assets: $133,376 (2019) | $97,334 (2018)
**Liabilities and Stockholders' Equity**
- **Current Liabilities:**
- Accounts payable: $1,363 (2019) | $820 (2018)
- Partners payable: $886 (2019) | $541 (2018)
- Operating lease liabilities, current: $800 (2019)
- Accrued expenses and other current liabilities: $11,735 (2019) | $5,509 (2018)
- Deferred revenue and deposits: $269 (2019) | $147 (2018)
- Total current liabilities: $15,053 (2019) | $7,017 (2018)
- **Non-Current Liabilities:**
- Operating lease liabilities, non-current: $9,524 (2019)
- Other liabilities: $7,745 (2019) | $6,190 (2018)
- Total liabilities: $32,322 (2019) | $13,207 (2018)
- **Stockholders'

Transcribed Image Text:**Financial Summary for Years Ended December 31, 2019, 2018, and 2017**
**Revenue:**
- 2019: $70,697
- 2018: $55,838
- 2017: $40,653
**Costs and Expenses:**
1. **Cost of Revenue:**
- 2019: $12,770
- 2018: $9,355
- 2017: $3,454
2. **Research and Development:**
- 2019: $13,600
- 2018: $10,273
- 2017: $7,754
3. **Marketing and Sales:**
- 2019: $9,876
- 2018: $7,846
- 2017: $4,725
4. **General and Administrative:**
- 2019: $10,465
- 2018: $3,451
- 2017: $2,517
**Total Costs and Expenses:**
- 2019: $46,711
- 2018: $30,925
- 2017: $20,450
**Income from Operations:**
- 2019: $23,986
- 2018: $24,913
- 2017: $20,203
**Interest and Other Income, Net:**
- 2019: $826
- 2018: $448
- 2017: $391
**Income Before Provision for Income Taxes:**
- 2019: $24,812
- 2018: $25,361
- 2017: $20,594
**Provision for Income Taxes:**
- 2019: $6,327
- 2018: $3,249
- 2017: $4,660
**Net Income:**
- 2019: $18,485
- 2018: $22,112
- 2017: $15,934
This table provides a snapshot of financial performance over three years, detailing revenue and various cost components, as well as the resulting net income. Each line item represents key operational areas influencing overall financial health.
Expert Solution
Step 1
Ratio Analysis
It is a technique by which the financial position of a company is analyzed. This technique involves computing different ratios in order to compare the current position of the company with earlier period or to evaluate the current position.
Step 2
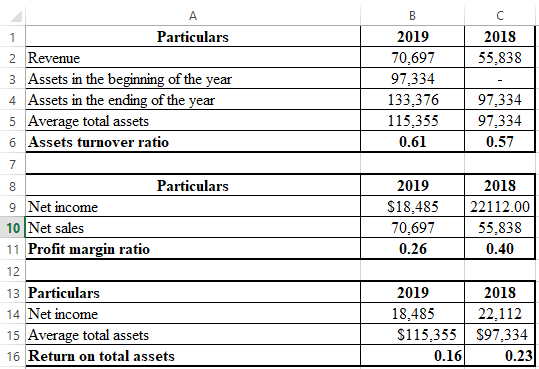
Requirement 1,2&3:
The asset turnover, profit margin, and return on total asset ratio are calculated as follows:
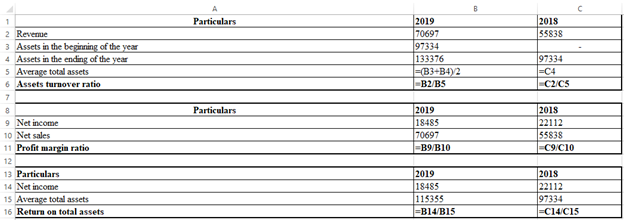
The resultant table is as follows:

Step by step
Solved in 3 steps with 4 images

Knowledge Booster


Learn more about
Need a deep-dive on the concept behind this application? Look no further. Learn more about this topic, accounting and related others by exploring similar questions and additional content below.Recommended textbooks for you

Accounting
Accounting
ISBN:
9781337272094
Author:
WARREN, Carl S., Reeve, James M., Duchac, Jonathan E.
Publisher:
Cengage Learning,

Accounting Information Systems
Accounting
ISBN:
9781337619202
Author:
Hall, James A.
Publisher:
Cengage Learning,
Accounting
Accounting
ISBN:
9781337272094
Author:
WARREN, Carl S., Reeve, James M., Duchac, Jonathan E.
Publisher:
Cengage Learning,
Accounting Information Systems
Accounting
ISBN:
9781337619202
Author:
Hall, James A.
Publisher:
Cengage Learning,

Horngren's Cost Accounting: A Managerial Emphasis…
Accounting
ISBN:
9780134475585
Author:
Srikant M. Datar, Madhav V. Rajan
Publisher:
PEARSON

Intermediate Accounting
Accounting
ISBN:
9781259722660
Author:
J. David Spiceland, Mark W. Nelson, Wayne M Thomas
Publisher:
McGraw-Hill Education

Financial and Managerial Accounting
Accounting
ISBN:
9781259726705
Author:
John J Wild, Ken W. Shaw, Barbara Chiappetta Fundamental Accounting Principles
Publisher:
McGraw-Hill Education