Concept explainers
Videos
Interpretation of Regression Results: Simple Regression Using a Spreadsheet
Hartman Company’s Lucas plant manufactures thermostatic controls. Plant management has experienced fluctuating monthly
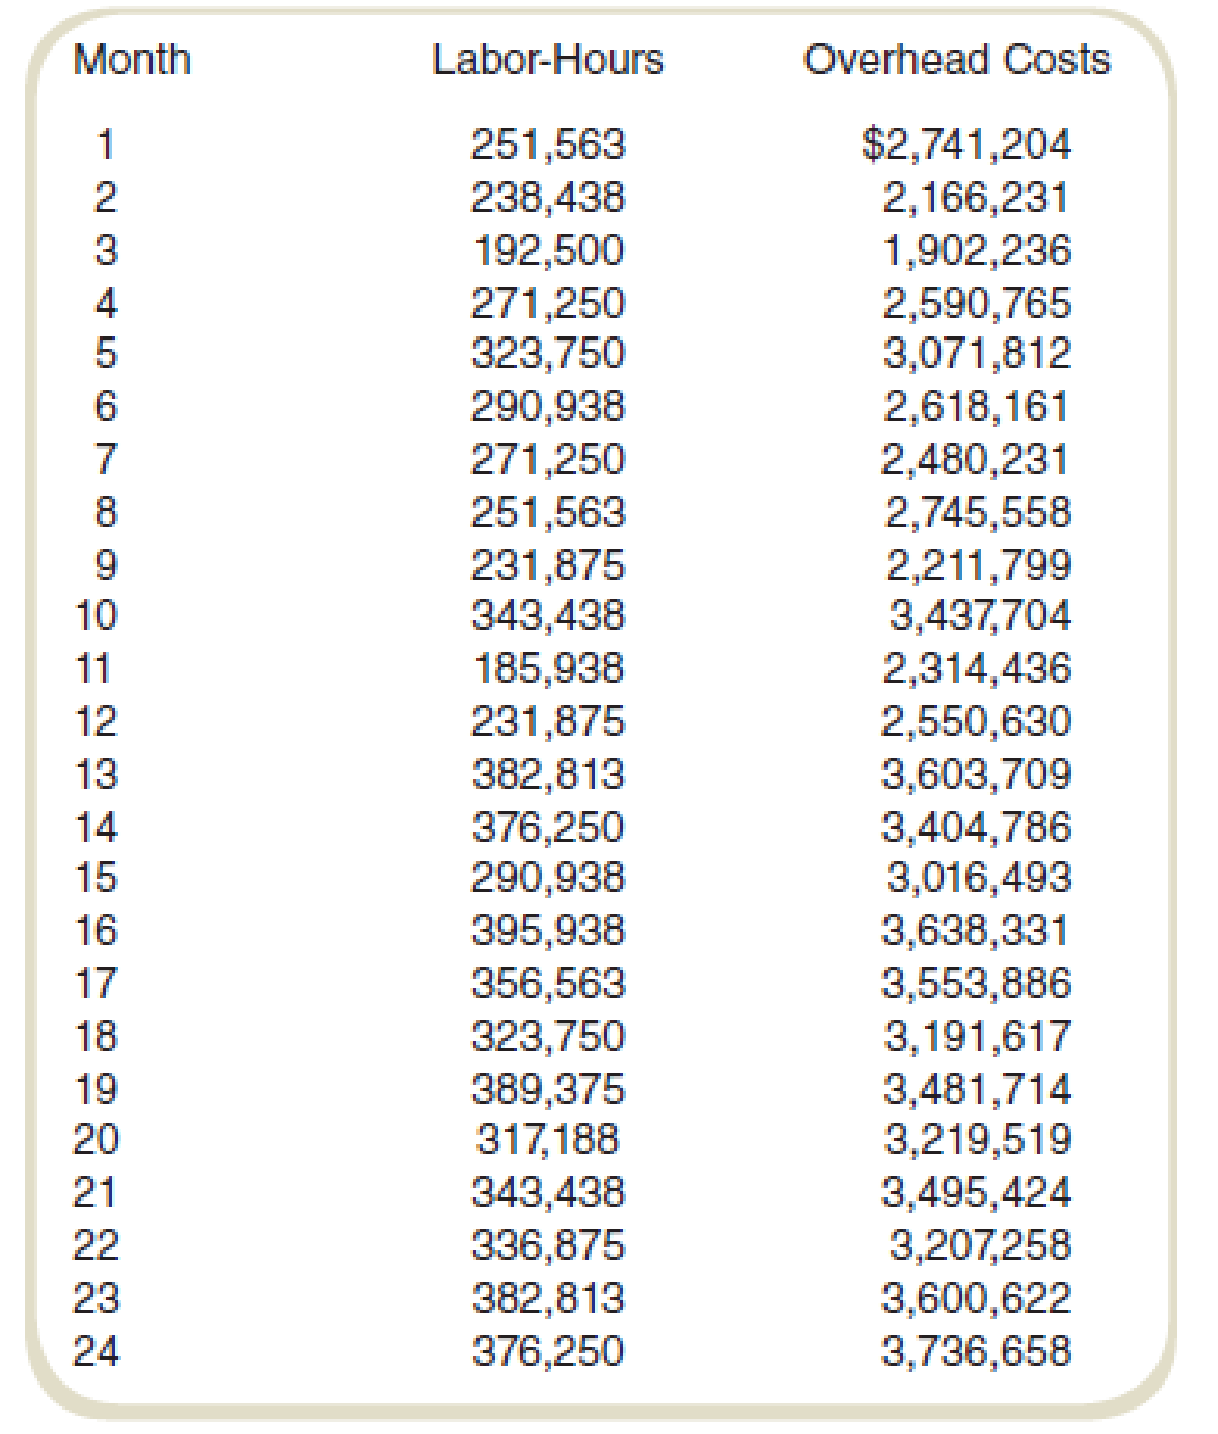
A member of the controller’s staff proposed that the behavior pattern of these overhead costs be determined to improve cost estimation. Another staff member suggested that a good starting place for determining cost behavior patterns is to analyze historical data. Following this suggestion, monthly data were gathered on labor-hours and overhead costs for the past two years. No major changes in operations occurred over this period of time. The data are shown in the following table:
Required
- a. Use the high-low estimation method to estimate the overhead cost behavior (fixed and variable portions components of cost) for the Lucas plant.
- b. Prepare a scattergraph showing the overhead costs plotted against the labor-hours.
- c. Use a spreadsheet program to compute regression coefficients to describe the overhead cost equation.
- d. Use the results of your regression analysis to develop an estimate of overhead costs assuming 350,000 labor-hours will be worked next month.
a.
Estimate the monthly fixed costs and the unit variable cost per machine-hour using the high-low estimation method.
Explanation of Solution
High-low cost method:
High-low cost method helps in separating the fixed and variable cost from the total cost. It is calculated by comparing the highest and lowest level of activities and the cost of these activities.
Show the cost equation of fixed and variable cost with the overhead cost:
Thus, the cost equation is
Working note 1:
Calculate the fixed cost:
Calculate the highest and lowest activity:
| Particular | Labor hours | Overhead costs |
| Highest activity | 395,938 | $3,638,331 |
| Lowest activity | 185,938 | $2,314,436 |
Table: (1)
Working note 2:
Calculate the variable cost (unit) with the help of high-low cost method:
Working note 3:
Calculate the variable cost ($) with the help of high-low cost method:
b.
Draw a scatter graph relating call center costs to the number of support calls.
Explanation of Solution
Scatter graph:
Scatter graph shows the relationship between the cost and the activity. It shows the cost at various level of activity. It helps in finding the outlier in the data. So the management can eliminate it to make more effective decisions
Prepare a scatter graph for overhead cost and labor hours:
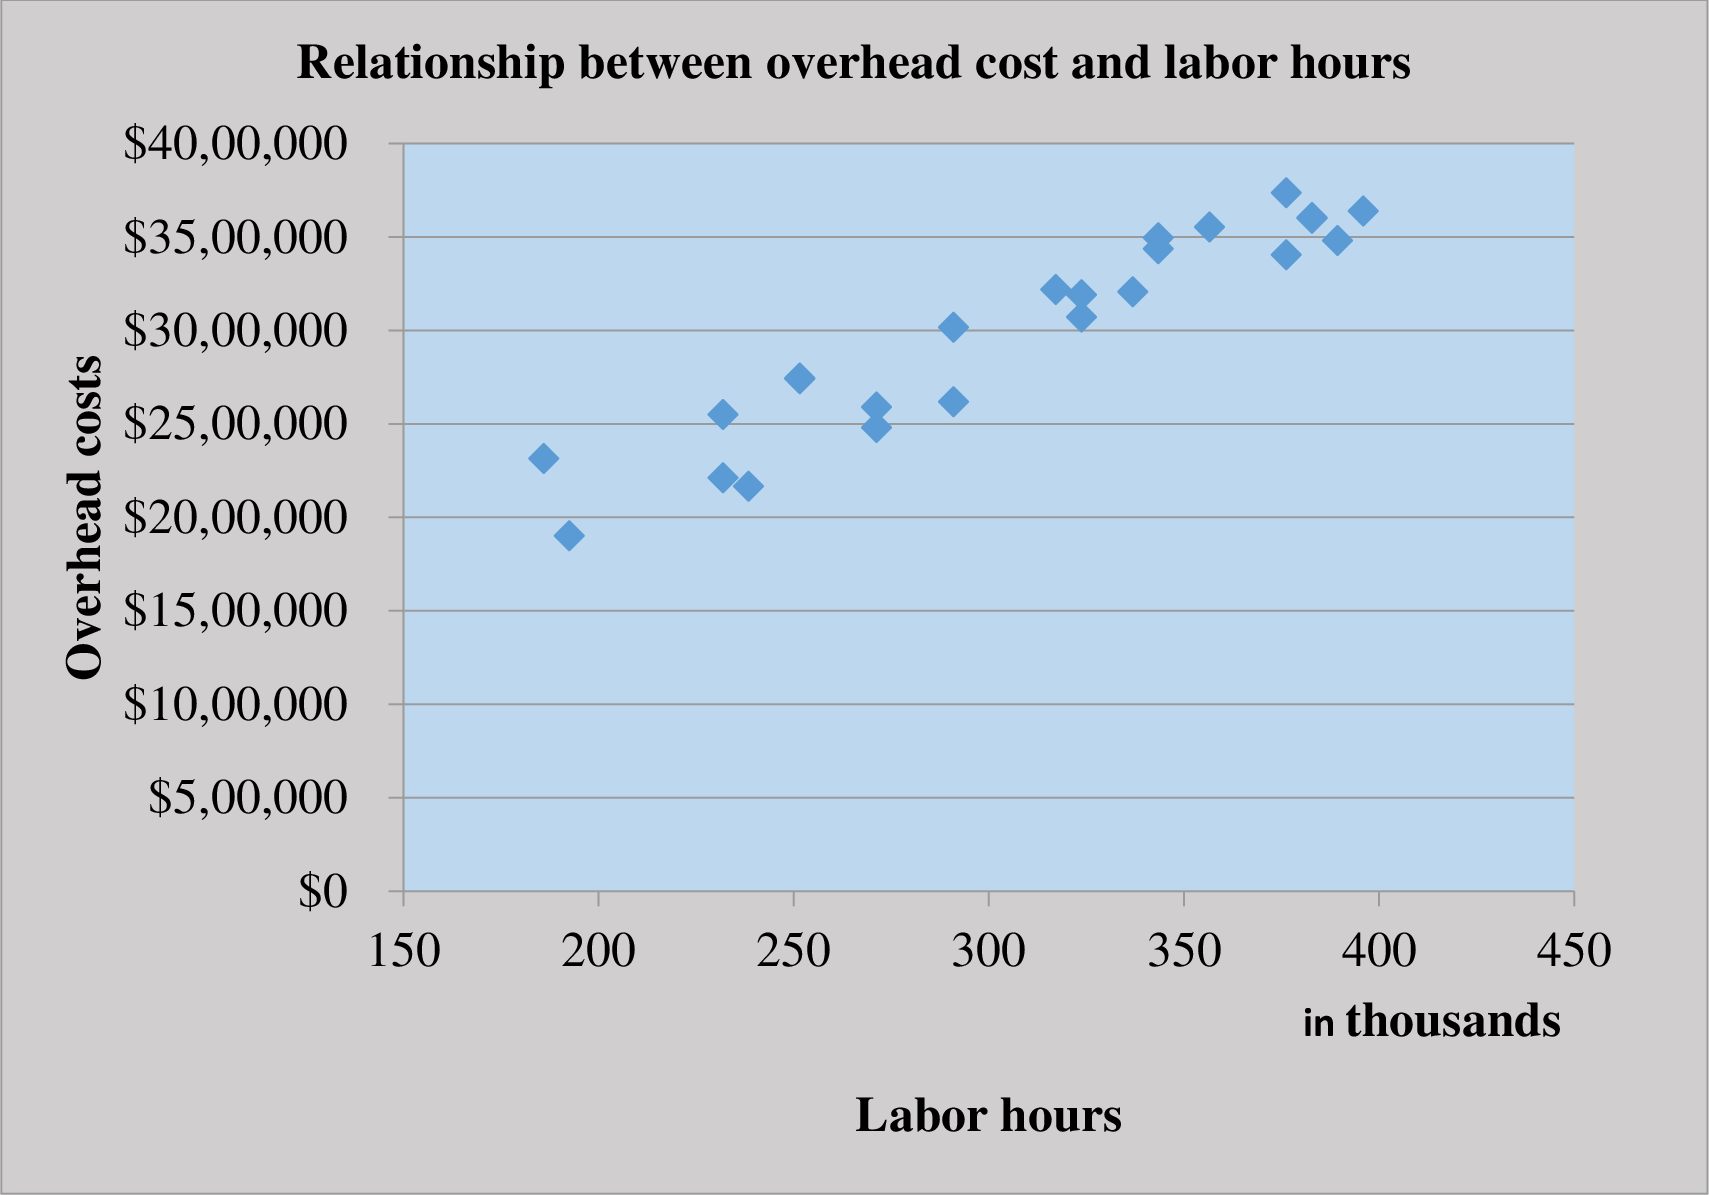
The scatter plot represents labor hours on the horizontal axis and the overhead costs on the vertical axis.
c.
Use a spreadsheet program to compute regression coefficients to describe the overhead cost equation.
Explanation of Solution
Cost equation:
Cost equation is a mathematical representation of the cost estimation at various level of activity. It is used by defining the fixed cost, and variable cost per unit and then the variable cost per unit is multiplied by the given variable to calculate the relative cost.
Calculate the overhead cost equation with the help of regression coefficients:
| Regression Statistics | ||||||||
| Multiple R | 0.94878 | |||||||
| R Square | 0.900184 | |||||||
| Adjusted R Square | 0.895647 | |||||||
| Standard Error | 176381.9 | |||||||
| Observations | 24 | |||||||
| ANOVA | ||||||||
| df | SS | MS | F | Significance F | ||||
| Regression | 1 | 6.17E+12 | 6.17E+12 | 198.4054 | 1.73E-12 | |||
| Residual | 22 | 6.84E+11 | 3.11E+10 | |||||
| Total | 23 | 6.86E+12 | ||||||
| Coefficients | Standard Error | t Stat | P-value | Lower 95% | Upper 95% | Lower 95.0% | Upper 95.0% | |
| Intercept | 533857.1 | 178689.9 | 2.987618 | 0.006786 | 163277 | 904437.3 | 163277 | 904437.3 |
| X Variable 1 | 8.042909 | 0.571 | 14.08565 | 1.73E-12 | 6.858726 | 9.227091 | 6.858726 | 9.227091 |
Table: (2)
The regression analysis of the company provides the following details:
Calculate the cost equation:
Put the values in the cost equation:
Thus, the overhead cost is:
d.
Use the results of your regression analysis to develop an estimate of overhead costs assuming 350,000 labor-hours will be worked next month.
Answer to Problem 60P
The overhead cost is $3,347,857.
Explanation of Solution
Regression analysis:
Regression analysis is used to show the relationship between the cost and the activity. It is used to estimate the cost at various level of activity.
The most important step in the calculation of regression analysis is to establish a logical relationship between the cost and the activity. The activity (independent variable) is placed on the right-hand side, and the cost (dependent variable) is placed on the left-hand side of the graph.
Calculate the overhead cost:
Thus, the overhead cost is $3,347,857.
Want to see more full solutions like this?
Chapter 5 Solutions
Fundamentals Of Cost Accounting (6th Edition)


- The management of Wheeler Company has decided to develop cost formulas for its major overhead activities. Wheeler uses a highly automated manufacturing process, and power costs are a significant manufacturing cost. Cost analysts have decided that power costs are mixed; thus, they must be broken into their fixed and variable elements so that the cost behavior of the power usage activity can be properly described. Machine hours have been selected as the activity driver for power costs. The following data for the past eight quarters have been collected: Required: 1. Prepare a scattergraph by plotting power costs against machine hours. Does the scatter-graph show a linear relationship between machine hours and power cost? 2. Using the high and low points, compute a power cost formula. 3. Use the method of least squares to compute a power cost formula. Evaluate the coefficient of determination. 4. Rerun the regression and drop the point (20,000; 26,000) as an outlier. Compare the results from this regression to those for the regression in Requirement 3. Which is better?arrow_forwardScattergraph method Using the data in P4-2 and a piece of graph paper: 1. Plot the data points on the graph and draw a line by visual inspection, indicating the trend shown by the data points. 2. Determine the variable cost per unit and the total fixed cost from the information on the graph. 3. Determine the variable cost to be charged to the product for the year. 4. Determine the fixed cost to be charged to factory overhead for the year. 5. Do these answers agree with the answers to P4-2? Why or why not?arrow_forwardElmo Security Consultants (ESC) offer a standardized review of data security for small business owners. The following data apply to the provision of these reviews: Sales price per unit (1 unit = 1 review with recommendations) Fixed costs (per month): Selling and administration Production overhead (e.g., rent of facilities) Variable costs (per review): Labor for oversight and feedback. Outsourced security analysis Materials used in reviews Review overhead Selling and administration (e.g., scheduling and billing) Number of reviews per month a. Variable review (production) cost per unit b. Variable total cost per unit c. Full cost per unit d. Full absorption cost per unit e. Prime cost per unit Required: Calculate the amount for each of the following (one unit = one review) if the number of reviews is 2,500 per month. Also calculate if the number of reviews decreases to 2,000 per month. Note: Do not round intermediate calculations. Round your final answers to the nearest whole dollar. f.…arrow_forward
- Elmo Security Consultants (ESC) offer a standardized review of data security for small business owners. The following data apply to the provision of these reviews: Sales price per unit (1 unit = 1 review with recommendations) Fixed costs (per month): Selling and administration Production overhead (e.g., rent of facilities) Variable costs (per review): Labor for oversight and feedback Outsourced security analysis Materials used in reviews Review overhead Selling and administration (e.g., scheduling and billing) Number of reviews per month Required: a. Variable review (production) cost per unit b. Variable total cost per unit c. Full cost per unit d. Full absorption cost per unit e. Prime cost per unit f. Conversion cost per unit Calculate the amount for each of the following (one unit = one review) if the number of reviews is 2,500 per month. Also calculate if the number of reviews decreases to 2,000 per month. g. Contribution margin per unit h. Gross margin per unit 2,500 Reviews $ 500…arrow_forwardElmo Security Consultants (ESC) offer a standardized review of data security for small business owners. The following data apply to the provision of these reviews: Sales price per unit (1 unit = 1 review with recommendations) Fixed costs (per month): Selling and administration Production overhead (e.g., rent of facilities) Variable costs (per review): Labor for oversight and feedback Outsourced security analysis Materials used in reviews Review overhead Selling and administration (e.g., scheduling and billing) Number of reviews per month Required: d. Full absorption cost per uni! e. Prime cost per unit t Conversion cost per unit 9. Contribution margin per unit h. Gross margin per uni! 2,500 Reviews $ 508 50,000 70,000 Calculate the amount for each of the following (one unit = one review) if the number of reviews is 2.500 per month. Also calculate if the number of reviews decreases to 2,000 per month. 2,000 Reviews 250 43 10 28 38 2,508 reviewsarrow_forwardElmo Security Consultants (ESC) offer a standardized review of data security for small business owners. The following data apply to the provision of these reviews: Sales price per unit (1 unit 1 review with recommendations) Fixed costs (per month): Selling and administration Production overhead (e.g., rent of facilities) Variable costs (per review): Labor for oversight and feedback Outsourced security analysis Materials used in reviews Review overhead Selling and administration (e.g., scheduling and billing) Number of reviews per month a Variable review (production) cost per unit b. Variable total cost per unit Required: Calculate the amount for each of the following (one unit = one review) if the number of reviews is 2,500 per month. Also calculate if the number of reviews decreases to 2,000 per month. c. Full cost per unit d. Full absorption cost per unit e. Prime cost per unit f. Conversion cost per unit g Contribution margin per unit h. Gross margin per unit 2,500 Reviews $ 500…arrow_forward
- Cost Classification and Behaviour—Spark Electrical Company Spark Electrical Company manufactures electrical components. Plant management has experienced difficulties with fluctuating monthly overhead costs. Management wants to be able to estimate overhead costs to plan its operations and financial needs. A trade association publication reports that for companies manufacturing electrical components, overhead tends to vary with machine hours. Monthly data was gathered on machine hours and overhead costs for the past two years. There were no major changes in operations over this period of time. The raw data is: Month Number Machine Hours Overhead Costs ($) 1 20,000 84,000 2 25,000 99,000 3 22,000 89,500 4 23,000 90,000 5 20,000 81,500 6 19,000 75,500 7 14,000 70,500 8 10,000 64,500 9 12,000 69,000 10 17,000 75,000 11 16,000 71,500 12 19,000 78,000 13 21,000 86,000 14 24,000 93,000 15 23,000 93,000 16 22,000 87,000 17 20,000 80,000…arrow_forwardNeed some help making a cheet sheet for an up coming test. please provide examples. The exam covers chapters 1 through 13. Here are some suggested study topics: Cost Classifications - variable, fixed and mixed, period and product, direct and indirect, opportunity, sunk, relevant, traceable, common, etc. Calculate the results of changes to cost assumptions (CVP) Calculate net income based on contribution margin values either dollars or % Application of Manufacturing Overhead - calculate predetermined overhead rate or activity rates applied to a product or job - job order using a predetermined overhead rate or rates and activity-based costing calculate over and underapplied overhead calculate adjusted cost of goods sold Job Costing What is the total cost of the job and average cost per unit. Cost of Goods Manufactured and cost of goods sold Calculate break even and target profit Create a contribution format income statement Gross margin calculations - absorption or variable costing…arrow_forwardArklan Production is upgrading its manufacturing process from a manual process to a highly automated system. Management believes that the new system will result in greater efficiencies and a better finished product. Arklan is also working on a plan to downsize staff after the implementation of the new system. Arklan has used a traditional absorption costing system to calculate unit product costs for external financial reporting. In the past, Arklan has allocated its manufacturing overhead costs using a predetermined plant-wide overhead rate based on direct labor hours. The controller realizes that the new system may require changing the overhead allocation process. Management plans to take the opportunity to reconsider other improvements to the costing system. Identify and explain three benefits of using departmental overhead rates to allocate overhead costs. Explain the difference between absorption costing and variable costing. Identify which is more suitable for internal…arrow_forward
- Cost Classification Match each cost to the appropriate cost behavior pattern shown in graphs (a) through (l). Any graph can fit two or more patterns. The cost of lumber used to manufacture wooden kitchen tables. The cost of order fillers in a warehouse. When demand increases significantly, the number of order fillers is increased, and when demand falls off significantly, the number is decreased. The salary of the plant’s quality control inspector, who inspects each batch of products. The cost of water and sewer service to the manufacturing plant. The local municipality charges a fixed rate per gallon for usage up to 10,000 gallons and a higher charge per gallon for usage above that point. The cost of an internet connection of $23 per month. The cost of an internet connection of $10 per month plus $2 per hour of usage above 10 hours. The cost to make copies of a given document at a printing shop, where the per-copy charge is reduced for customers who make more than…arrow_forwardThe managerial accountant at Fast and Mean Manufacturing reported that the organization contains an automated production line to manufacture and produce its products for consumers to enjoy in the marketplace. The managerial accountant reported that the company uses the high-low method to estimate the costs in the new budget. The managerial accountant reported the following information: Compute the slope of the mixed cost, or the variable cost per unit of activity. Compute the vertical intercept, or the fixed cost component of the mixed cost. What is the mixed cost equation? Month Total machine hours total cost January 250,000 $5,500,000 February 248,000 $5,260,000 March 249,000 $5,400,000 April 248,000 $5,220,000 May 238,000 $5,180,000 June 230,000 $5,130,000arrow_forwardThe following situations describe decision scenarios that could use managerial accounting information: The manager of High Times Restaurant wishes to determine the price to charge for various lunch plates. By evaluating the cost of leftover materials, the plant manager of a precision tool facility wishes to determine how effectively the plant is being run. The division controller of West Coast Supplies needs to determine the cost of products left in inventory. The manager of the Maintenance Department of a large manufacturing company wishes to plan next year’s anticipated expenditures. For each situation, discuss how managerial accounting information could be used. b) What are the major differences between managerial accounting and financial accounting?arrow_forward
 Managerial AccountingAccountingISBN:9781337912020Author:Carl Warren, Ph.d. Cma William B. TaylerPublisher:South-Western College Pub
 Cornerstones of Cost Management (Cornerstones Ser...AccountingISBN:9781305970663Author:Don R. Hansen, Maryanne M. MowenPublisher:Cengage Learning
 Principles of Cost AccountingAccountingISBN:9781305087408Author:Edward J. Vanderbeck, Maria R. MitchellPublisher:Cengage Learning
 Essentials of Business Analytics (MindTap Course ...StatisticsISBN:9781305627734Author:Jeffrey D. Camm, James J. Cochran, Michael J. Fry, Jeffrey W. Ohlmann, David R. AndersonPublisher:Cengage Learning
 Managerial Accounting: The Cornerstone of Busines...AccountingISBN:9781337115773Author:Maryanne M. Mowen, Don R. Hansen, Dan L. HeitgerPublisher:Cengage Learning
 Financial And Managerial AccountingAccountingISBN:9781337902663Author:WARREN, Carl S.Publisher:Cengage Learning,