
Videos
The article “Gypsum Effect on the Aggregate Size and Geometry of Three Sodic Soils Under Reclamation” (I. Lebron, D. Suarez, and T. Yoshida, Journal of the Soil Science Society of America, 2002:92–98) reports on an experiment in which gypsum was added in various amounts to soil samples before leaching. One of the outcomes of interest was the pH of the soil. Gypsum was added in four different amounts. Three soil samples received each amount added. The pH measurements of the samples are presented in the following table.
| Gypsum (g/kg) | pH | ||
| 0.00 | 7.88 | 7.72 | 7.68 |
| 0.11 | 7.81 | 7.64 | 7.85 |
| 0.19 | 7.84 | 7.63 | 7.87 |
| 0.38 | 7.80 | 7.73 | 8.00 |
Can you conclude that the pH differs with the amount of gypsum added? Provide the value of the test statistic and the P-value.
Check whether the mean pH level differs for the different amounts of gypsum added.
Find the value of test statistic and P-value.
Answer to Problem 1SE
The test statistic is 0.29 and the P-value is 0.832.
There is no sufficient evidence to conclude that the mean pH level differs for the different amounts of gypsum added.
Explanation of Solution
Given info:
The design variable is the Gypsum and the response is the pH measurement. The table provides the pH measurement corresponding to Gypsum.
Calculation:
State the hypotheses:
Null hypothesis:
Alternative hypothesis:
The ANOVA table can be obtained as follows:
Software procedure:
Step by step procedure to obtain One-Way ANOVA using the MINITAB software:
- Choose Stat > ANOVA > One-Way.
- In Response, enter the column of pH.
- In Factor, enter the column of Gypsum.
- In Confidence level, enter 0.95.
- Click OK.
Output using the MINITAB software is given below:
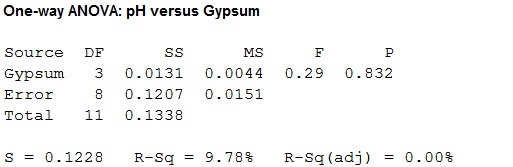
From the ANOVA table, the P-value is 0.832 and the F-value is 0.29.
Decision:
If
If
Since, the level of significance is not specified; the prior level of significance
Conclusion:
Here, the P-value is greater than the level of significance.
That is,
By rejection rule, fails to reject the null hypothesis.
There is sufficient evidence to conclude that the mean pH level differs for the different amounts of gypsum added at
Want to see more full solutions like this?
Chapter 9 Solutions
Statistics for Engineers and Scientists
Additional Math Textbook Solutions
Statistics for Business and Economics (13th Edition)
Statistical Techniques in Business and Economics
Statistics: Informed Decisions Using Data (5th Edition)
Probability and Statistics for Engineering and the Sciences
Elementary Statistics ( 3rd International Edition ) Isbn:9781260092561
EBK STATISTICAL TECHNIQUES IN BUSINESS


- The compressive strength of concrete is being studied and four different mixing techniques are being investigated. The following data have been collected. Compressive Strength (psi) 1 3129 3000 2865 2890 Mixing Technique a.) What is the problem? b.) What are the hypotheses? 2 3200 3300 2975 3150 3 2800 2900 2985 3050 4 2600 2700 2600 2765 Test the hypothesis that mixing techniques affect the strength of the concrete. Use a = 0.05. c.) Using EXCEL, provide a screenshot of the results. d.) Conclusionarrow_forwardThe article "Experimental Measurement of Radiative Heat Transfer in Gas-Solid Suspension Flow System" (G. Han, K. Tuzla, and J. Chen, AIChe Journal, 2002:1910- 1916) discusses the calibration of a radiometer. Several measurements were made on the electromotive force readings of the radiometer (in volts) and the radiation flux (in kilowatts per square meter). The results (read from a graph) are presented in the following table. Heat flux (y) 15 31 51 55 67 89 Signal output (x) 1.08 2.42 4.17 4.46 5.17 6.92 Compute the least-squares line for predicting heat flux from the signal output. If the radiometer reads 3.00 V, predict the heat flux. If the radiometer reads 8.00 V, should the heat flux be predicted? If so, predict it. If not, explain why. C.arrow_forwardThe article "Characteristics and Trends of River Discharge into Hudson, James, and Ungava Bays, 1964-2000" (S. Dery, M. Stieglitz, et al., Journal of Climate, 2005:2540-2557) presents measurements of discharge rate x (in kmlyr) andpeakflow y (in m/s) for 42 rivers that drain into the Hudson, James, and Ungava Bays. The data are shown in the following table: Discharge Peak Flow 94.24 4110.3 66.57 4961.7 59.79 10275.5 48.52 6616.9 40.00 7459.5 32.30 2784.4 31.20 3266.7 30.69 4368.7 26.65 1328.5 22.75 4437.6 21.20 1983.0 20.57 1320.1 19.77 1735.7 18.62 1944.1 17.96 3420.2 17.84 2655.3 16.06 3470.3 1561.6 14.69 11.63 869.8 11.19 936.8 11.08 1315.7 10.92 1727.1 9.94 768.1 7.86 483.3arrow_forward
- Cheek teeth of extinct primates. The characteristics of cheek teeth (e.g., molars) can provide anthropologists with information on the dietary habits of extinct mammals. The cheek teeth of an extinct primate species were the subject of research reported in the American Journal of Physical Anthropology (Vol. 142, 2010). A total of 18 cheek teeth extracted from skulls discovered in western Wyoming were analyzed. Researchers recorded the dentary depth of molars (in millimeters) for a sample of 18 cheek teeth extracted from skulls. These depth measurements are listed in the accompanying table. Anthropologists know that the mean dentary depth of molars in an extinct primate species— called Species A—is 15 millimeters. Is there evidence to indicate that the sample of 18 cheek teeth come from some other extinct primate species (i.e., some species other than Species A)? The data are given below (you will need to put it into a single column). You will need to calculate the sample…arrow_forward! Required information The article "Gypsum Effect on the Aggregate Size and Geometry of Three Sodic Soils Under Reclamation" (I. Lebron, D. Suarez, and T. Yoshida, Journal of the Soil Science Society of America, 2002:92-98) reports the effect of gypsum on the electric conductivity (in dS m¯¹) of soil. Two types of soil were each treated with three different amounts of gypsum, with two replicates for each soil-gypsum combination. The data are presented in the following table. Gypsum (g/kg) Soil Type Las Animas Madera 0 1.52 1.05 1.01 0.92 0.27 0.46 1.49 0.91 1.12 0.92 0.99 0.92 0.88 0.92 Is there convincing evidence of an interaction between the amount of gypsum and soil type? Compute the test statistic, find the P- value and state a conclusion. (Round the final answer to three decimal places.)arrow_forwardThe article "Effect of Granular Subbase Thickness on Airfield Pavement Structural Response" (K. Gopalakrishnan and M. Thompson, Journal of Materials in Civil Engineering, 2008:331-342) presents a study of the effect of the subbase thickness (in mm) on the amount of surface deflection caused by aircraft landing on an airport runway. Two landing gears, one simulating a Boeing 747 aircraft, and the other a Boeing 777 aircraft, were trafficked across four test sections of runway. The results are presented in the following table. Section 3 4 Boeing 747 Boeing 777 4.01 3.87 3.72 3.76 4.57 4.48 4.36 4.43 Can you conclude that the mean deflection is greater for the Boeing 777?arrow_forward
- Wild irises are beautiful flowers found throughout the United States, Canada, and northern Europe. This problem concerns the length of the sepal (leaf-like part covering the flower) of different species of wild iris. Data are based on information taken from an article by R. A. Fisher in Annals of Eugenics (Vol. 7, part 2, pp. 179 -188). Measurements of sepal length in centimeters from random samples of Iris setosa (I), Iris versicolor (II), and Iris virginica (III) are as follows below. I II III 5.7 5.1 6.5 4.7 6.2 5.1 4.7 6.6 4.7 5.8 4.9 7.5 4.6 5.2 5.3 5.3 6.2 6.2 5.4 5.8 6.4 (b) Find SSTOT, SSBET, and SSW and check that SSTOT = SSBET + SSW. (Use 3 decimal places.) SSTOT = SSBET = SSW = Find d.f.BET, d.f.W, MSBET, and MSW. (Use 4 decimal places for MSBET, and MSW.) dfBET = dfW = MSBET = MSW = Find the value of the sample F statistic. (Use 2 decimal places.)What are the degrees of freedom? (numerator) (denominator)arrow_forwardWild irises are beautiful flowers found throughout the United States, Canada, and northern Europe. This problem concerns the length of the sepal (leaf-like part covering the flower) of different species of wild iris. Data are based on information taken from an article by R. A. Fisher in Annals of Eugenics (Vol. 7, part 2, pp. 179 -188). Measurements of sepal length in centimeters from random samples of Iris setosa (I), Iris versicolor (II), and Iris virginica (III) are as follows below. I II III 5.5 5.2 6.8 4.6 6.5 5.3 5.1 6.1 4.4 5.5 4.1 7.9 4.1 5.1 5.9 5.4 6.1 6.9 5.4 5.1 6.6 Shall we reject or not reject the claim that there are no differences among the population means of sepal length for the different species of iris? Use a 5% level of significance. (a) What is the level of significance?State the null and alternate hypotheses. Ho: ?1 = ?2 = ?3; H1: Exactly two means are equal.Ho: ?1 = ?2 = ?3; H1: Not all the means are equal. Ho: ?1 = ?2 = ?3; H1:…arrow_forwardWild irises are beautiful flowers found throughout the United States, Canada, and northern Europe. This problem concerns the length of the sepal (leaf-like part covering the flower) of different species of wild iris. Data are based on information taken from an article by R. A. Fisher in Annals of Eugenics (Vol. 7, part 2, pp. 179 -188). Measurements of sepal length in centimeters from random samples of Iris setosa (I), Iris versicolor (II), and Iris virginica (III) are as follows below. I II III 5.9 5.8 6.9 4.8 6.5 5.6 4.6 6.4 4.9 5.7 4.3 7.7 4.8 5.8 5.6 5.4 6.3 6.3 5.8 5.5 6.6 Shall we reject or not reject the claim that there are no differences among the population means of sepal length for the different species of iris? Use a 5% level of significance. (b) Find SSTOT, SSBET, and SSW and check that SSTOT = SSBET + SSW. (Use 3 decimal places.) SSTOT = SSBET = SSW = Find d.f.BET, d.f.W, MSBET, and MSW. (Use 4 decimal places for MSBET, and…arrow_forward
- Wild irises are beautiful flowers found throughout the United States, Canada, and northern Europe. This problem concerns the length of the sepal (leaf-like part covering the flower) of different species of wild iris. Data are based on information taken from an article by R. A. Fisher in Annals of Eugenics (Vol. 7, part 2, pp. 179 -188). Measurements of sepal length in centimeters from random samples of Iris setosa (I), Iris versicolor (II), and Iris virginica (III) are as follows below. I II III 5.7 5.4 6.8 4.1 6.3 5.4 5.0 6.7 4.4 5.4 4.3 7.3 4.6 5.5 5.3 5.7 6.5 6.7 5.2 5.3 6.8 Shall we reject or not reject the claim that there are no differences among the population means of sepal length for the different species of iris? Use a 5% level of significance. (a) What is the level of significance?State the null and alternate hypotheses. Ho: ?1 = ?2 = ?3; H1: All three means are different.Ho: ?1 = ?2 = ?3; H1: Not all the means are equal. Ho: ?1 = ?2 = ?3;…arrow_forwardWild irises are beautiful flowers found throughout the United States, Canada, and northern Europe. This problem concerns the length of the sepal (leaf-like part covering the flower) of different species of wild iris. Data are based on information taken from an article by R. A. Fisher in Annals of Eugenics (Vol. 7, part 2, pp. 179 -188). Measurements of sepal length in centimeters from random samples of Iris setosa (I), Iris versicolor (II), and Iris virginica (III) are as follows below. I II III 5.9 5.5 6.7 4.1 6.8 5.8 5.2 6.5 4.5 5.4 4.5 7.2 4.1 5.4 5.2 5.2 6.2 6.9 5.6 5.2 6.7 Shall we reject or not reject the claim that there are no differences among the population means of sepal length for the different species of iris? Use a 10% level of significance. (a) What is the level of significance? 0.01 State the null and alternate hypotheses. O H,: H1 = H, = Hzi H;: All three means are different. O H,: H1 = H2 = Hzi H;: Exactly two means are equal. O H,: H, = H2 = Hai H,: At least two…arrow_forwardWild irises are beautiful flowers found throughout the United States, Canada, and northern Europe. This problem concerns the length of the sepal (leaf-like part covering the flower) of different species of wild iris. Data are based on information taken from an article by R. A. Fisher in Annals of Eugenics (Vol. 7, part 2, pp. 179 -188). Measurements of sepal length in centimeters from random samples of Iris setosa (I), Iris versicolor (II), and Iris virginica (III) are as follows below. I II III 5.6 5.5 6.9 4.5 6.6 5.5 5.4 6.5 4.3 5.4 4.6 7.9 4.7 5.6 5.8 5.9 6.6 6.3 5.6 5.6 6.9 Shall we reject or not reject the claim that there are no differences among the population means of sepal length for the different species of iris? (b) Find SSTOT, SSBET, and SSW and check that SSTOT = SSBET + SSW. (Use 3 decimal places.) SSTOT = SSBET = SSW = Find d.f.BET, d.f.W, MSBET, and MSW. (Use 4 decimal places for MSBET, and MSW.) dfBET = dfW =…arrow_forward
 MATLAB: An Introduction with ApplicationsStatisticsISBN:9781119256830Author:Amos GilatPublisher:John Wiley & Sons Inc
 Probability and Statistics for Engineering and th...StatisticsISBN:9781305251809Author:Jay L. DevorePublisher:Cengage Learning
 Statistics for The Behavioral Sciences (MindTap C...StatisticsISBN:9781305504912Author:Frederick J Gravetter, Larry B. WallnauPublisher:Cengage Learning
 Elementary Statistics: Picturing the World (7th E...StatisticsISBN:9780134683416Author:Ron Larson, Betsy FarberPublisher:PEARSON
 The Basic Practice of StatisticsStatisticsISBN:9781319042578Author:David S. Moore, William I. Notz, Michael A. FlignerPublisher:W. H. Freeman
 Introduction to the Practice of StatisticsStatisticsISBN:9781319013387Author:David S. Moore, George P. McCabe, Bruce A. CraigPublisher:W. H. Freeman