
Concept explainers
(a)
Time mean speed.
Answer to Problem 1P
The time mean speed is
Explanation of Solution
Given:
Observers stationed at two sections XX and YY, 500 ft apart on a highway, recording the time of vehicles on their arrival as shown in the accompanying table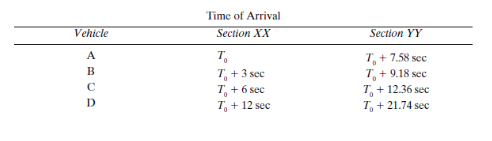
The total time of observation at XX was 15 sec.
In order to calculate time mean speed, we need to figure out traveling time of each vehicle which is the difference of time taken by a vehicle in travelling from XX to YY section between the two sections.
Calculation:
| Vehicles | Section XX | Section YY | Travelling time of vehicle, |
| A | | | |
| B | | | |
| C | | | |
| D | | | |
We have the following formula for the time mean speed:
Where,
n is the number of the vehicles passing.
Now, the speed of the individual vehicles is as follows:
Speed of vehicle A:
Speed of vehicle B:
Speed of vehicle C:
Speed of vehicle D:
Now, the time mean speed can be calculated by substituting the values in the following formula:
Conclusion:
Therefore, the time mean speed is
(b)
Space mean speed.
Answer to Problem 1P
The time mean speed is
Explanation of Solution
Given:
Observers stationed at two sections XX and YY, 500 ft apart on a highway, recording the time of vehicles on their arrivalas shown in the accompanying table.

The total time of observation at XX was 15 sec.
Calculation:
We have the following formula for finding out the space mean speed.
Where,
Substitute the values, we have:
Conclusion:
Therefore, the time mean speed is
(c)
Flow at section XX.
Answer to Problem 1P
The flow at section XX is as follows
Explanation of Solution
Given:
Observers stationed at two sections XX and YY, 500 ft apart on a highway, recording the time of vehicles on their arrival as shown in the accompanying table.

The total time of observation at XX was 15 sec.
Calculation:
We have the following formula for finding out the flow at XX section.
Where,
Substitute the values, we have:
Conclusion:
Therefore, the flow at section XX is as follows
Want to see more full solutions like this?
Chapter 6 Solutions
Traffic and Highway Engineering


- The data below shows the result of the flow of traffic at a certain part of a highway by observing the arrival time times for four vehicles at two sections A and B that are 200 m apart. The total observation time at a section A is 20 sec. find the following: a.) time mean speed (kph and in 3 decimals) b.) space mean speed (kph and in 3 decimals) c.) determine the flow at section A (veh/hr and in 3decimals)arrow_forwardAn intersection has a four-phase signal with the movements allowed in each phase and corresponding and saturation flow rates shown in the table below. Phase 1 2 3 4 Allowed movements EB L, WB L EB T/R, WB T/R SB L, SB T/R NB L, NB T/R Analysis flow rate 245, 230 veh/h 975, 1030 veh/h 255, 235 veh/h 225, 215 veh/h Saturation flow rate 1750, 1725 veh/h 3350, 3400 veh/h 1725, 1750 veh/h 1700, 1750 vehh Calculate the sum of the flow ratios for the critical lane groups. O 0.714 O 0.723 0.751 0.702arrow_forwardTwo set of students are collecting traffic data at the two sections A and B 300 meters apart long a highway . Observation at A shows that 5 vehicles pass that section at intervals of 9 sec , 10 sec, 11 sec, 13 sec, and 15 sec respectively. If the speed of the vehicles were 84, 76, 68, 60 and 52 kph, compute the time mean spee (kph), space mean speed (kph), density of the highwayarrow_forward
- An intersection has a three-phase signal with the movements allowed in each phase and corresponding analysis and saturation flow rates shown in the table below. Assume the lost time is 4 seconds per phase and a critical intersection v/c of 0.90 is desired. Phase Allowed movements NB L, SB L NB T/R, SB T/R EB L, WB L EB T/R, WB T/R Analysis flow rate 330, 365 veh/h 1125, 1075 veh/h 110, 80 veh/h 250, 285 veh/h Saturation flow rate 1700, 1750 veh/h 3400, 3300 veh/h 650, 600 veh/h 1750, 1800 veh/h Calculate the sum of the flow ratios for the critical lane groups. O 0.709 O 0.857 O 0.787 O 0.829arrow_forward3. A vehicle platoon was observed over a distance of 1000 ft on a single lane of Oak Street. entering at point A and departing at point B. Vehicle Time at A Time at B (sec) (sec) 1 35 2 (a) Trajectories (b) Avg. Volume Density & Space Mean Speed 37 3 39 4 5 42 5 44 6. 8. 48 (a) Plot the trajectories of these six vehicles on graph paper and (b) calculate the aver- age volume, density. and speed for these six vehicles observed, assuming the first 10 sec- onds at A as the period of observation.arrow_forwardTransportation Engineering Roll No. - 69 do the numerical part 2. Explain with the help of sketches various types of highway intersections. The 15 minute design traffic volume on cross road 1 and 2 during peak hour are observed as 180+R.No. and 150+R.No. vehicles per lane respectively. If the amber times required are 4 and 3 seconds respectively for two roads, design the signal timing by trial cycle (or exact) method. Assume average time headway of 2.5 sec during green phase. CO3arrow_forward
- An intersection has a three-phase signal with the movements allowed in each phase and corresponding analysis and saturation flow rates shown in the table below. Assume the lost time is 4 seconds per phase and a critical intersection v/c of 0.90 is desired. Phase 2 3 Allowed movements NB L, SB L NB T/R, SB T/R EB L, WBL EB T/R, WB T/R Analysis flow rate 330, 365 veh/h 1125, 1075 veh/h 110, 80 veh/h 250, 285 veh/h Saturation flow rate 1700, 1750 veh/h 3400, 3300 veh/h 650, 600 veh/h 1750, 1800 veh/h Calculate minimum cycle length O 255 sec O 155 sec O 100 sec O 60 secarrow_forwardAn intersection has a four-phase signal with the movements allowed in each phase and corresponding analysis and saturation flow rates shown in the table below. Phase 1 3 4 Allowed movements EB L, WB L EB T/R, WB T/R SB L, SB T/R NB L, NB T/R Analysis flow rate 245, 230 veh/h 975, 1030 veh/h 255, 235 veh/h 225, 215 veh/h Saturation flow rate 1750, 1725 vehh 3350, 3400 veh/h 1725, 1750 veh/h 1700, 1750 veh/h Calculate the optimum cycle length (Assume 4 seconds lost time per phase) O 116.466 sec O 104.693 sec 97.315 sec O 101.399 secarrow_forward1. An equation has been calibrated for the amount of time (in seconds) required to clear N vehicles through a given signal phase (N>5): T= 2.04 +2.35N a. What start-up lost time does this equation suggest? b. What saturation headway and saturation flow rate are implied by the equation? 2 The saturation flow rate for an intersection approach is 3600 veh/h. At the beginning of a cycle (effective red) no vehicles are queued. The signal is timed so that when the queue (from the continuously arriving vehicles) is 13 vehicles long, the effective green begins. If the queue dissipates 8 seconds before the end of the cycle and the cycle length is 60 seconds, what is the arrival rate, assuming D/D/1 queuing? 3 An intersection has a four-phase signal with the movements allowed in each phase and corresponding analysis and saturation flow rates shown in The table below Calculate the sum of the flow ratios for the critical lane groups. Phase Allowed movements Analysis flow rate Saturation flow rate…arrow_forward
- Observation post reveals that 8 vehicles passed through at intervals of 4.6 s, 6.23 s, 5.9 s, 7.1 s, 4.9 s, 3.8 s, 12.6 s, and 13.0 s, respectively. If the total distance travelled by the vehicles is 200 meters, i. If the density of traffic is 20 vpk, compute the rate of flow of traffic in vph. ii. If the speed limit imposed along the roadway is 100 kph, determine the percentage of speed limit violators.arrow_forwardAn intersection has a three-phase signal with the movement allowed in each phase and corresponding analysis and saturation flow rates shown in the table below. Assume the lost time is 4 seconds per phase and a critical intersection v/c of 0.90 is desired Phase 1 2 3 Allowed Movement NB L, SB L NB T/R, SB T/R EB L, WB L EB /T/R, WB T/R Analysis Flow Rate 330, 365 veh/h 1125, 1075 veh/h 110, 80 veh/h 250, 285 veh/h Saturation Flow Rate 1700, 1750 veh/h 3400, 300 veh/h 650, 600 veh/h 1750, 1800 veh/h Calculate the Following: 1.)Sum of flow ratios for critical lane groups 2.)minimum cycle length 3.)using v/c equation ratio, calculate the effective green time for phase 1 4.)using v/c equation ratio, calculate the effective green time for phase 2 5.)using v/c equation ratio, calculate the effective green time for phase 3arrow_forwardFor the geometric characteristics, traffic conditions (traffic volumes are in vehicles per hour) and signal timing shown below, complete parts A through E for the Northbound and Eastbound approaches. A. Adjust the volumes. B. Find the saturation flow rate. C. Find the degree of saturation. D. Find the theoretical delay for each movement. E. Find the theoretical delay and LOS for the EB and NB approaches. Bus stop 5 stops/hr $12 ft teach 6% HV 400 6% HV 650 100 12 ft each - Isolated signal with random arrivals, AT-3 - No residual demand delay 11 ft each - No bicycles or pedestrians Bus stop 5 stops/hr P C = 60 sec Lost time = 3.5 sec/ 7550 2% HV - G=42 Y=4 G=10; Y=4 G=8 Y=4 G=30 Y=4 Φ1 Φ2 ФЗ Assume the intersection is located at Central Business District (CBD) Assume that both the streets are located on level grades, i.e. G = 0 Assume a PHF = 0.95 Assume random arrival i.e. AT-3 Assume that the intersection is isolated and signal is pre-timedarrow_forward
 Traffic and Highway EngineeringCivil EngineeringISBN:9781305156241Author:Garber, Nicholas J.Publisher:Cengage Learning