
Concept explainers
Videos
Use Table 4, Appendix 3, to find the following
a P(0 ≤ Z ≤ 1.2)
b P(−.9 ≤ Z ≤ 0)
c P(.3 ≤ Z ≤ 1.56)
d P(−.2 ≤ Z ≤ .2)
e P(−1.56 ≤ Z ≤ −.2)
f Applet Exercise Use the applet Normal Probabilities to obtain P(0 ≤ Z ≤ 1.2). Why are the values given on the two horizontal axes identical?
a.
Find the value of
Answer to Problem 58E
The value of
Explanation of Solution
Calculation:
It is given that Z is normally distributed with mean 0 and standard deviation 1.
The following can be observed for Z:
Since, the standard normal distribution is symmetric about 0,
Use Table 4: Normal Curve Areas Standard normal probability in right-hand tail to obtain the probability as follows:
- Locate 0.0 along the z column.
- Locate 0 along the Second decimal place of z.
- The intersection of row and column gives the probability value of 0.5000.
Use Table 4: Normal Curve Areas Standard normal probability in right-hand tail to obtain the probability as follows:
- Locate 1.2 along the z column
- Locate 0 along the Second decimal place of z
- The intersection of row and column gives the probability value of 0.1151.
Thus, the value of
b.
Find the value of
Answer to Problem 58E
The value of
Explanation of Solution
Calculation:
The following can be observed for Z:
Since, the standard normal distribution is symmetric about 0,
Use Table 4: Normal Curve Areas Standard normal probability in right-hand tail to obtain the probability as follows:
- Locate 0.0 along the z column.
- Locate 0 along the Second decimal place of z.
- The intersection of row and column gives the probability value of 0.5000.
Use Table 4: Normal Curve Areas Standard normal probability in right-hand tail to obtain the probability as follows:
- Locate 0.9 along the z column.
- Locate 0 along the Second decimal place of z.
- The intersection of row and column gives the probability value of 0.1841.
Thus, the value of
c.
Find the value of
Answer to Problem 58E
The value of
Explanation of Solution
Calculation:
The following can be observed for Z:
Use Table 4: Normal Curve Areas Standard normal probability in right-hand tail to obtain the probability as follows:
- Locate 0.3 along the z column
- Locate 0 along the Second decimal place of z
- The intersection of row and column gives the probability value of 0.3821.
Use Table 4: Normal Curve Areas Standard normal probability in right-hand tail to obtain the probability as follows:
- Locate 1.5 along the z column
- Locate 6 along the Second decimal place of z
- The intersection of row and column gives the probability value of 0.0594.
Thus, The value of
d.
Find the value of
Answer to Problem 58E
The value of
Explanation of Solution
Calculation:
The following can be observed for Z:
Since, the standard normal distribution is symmetric about 0,
Use Table 4: Normal Curve Areas Standard normal probability in right-hand tail to obtain the probability as follows:
- Locate 0.2 along the z column
- Locate 0 along the Second decimal place of z
- The intersection of row and column gives the probability value of 0.4207.
Thus, the value of
e.
Find the value of
Answer to Problem 58E
The value of
Explanation of Solution
Calculation:
The following can be observed for Z:
Since, the standard normal distribution is symmetric about 0,
Use Table 4: Normal Curve Areas Standard normal probability in right-hand tail to obtain the probability as follows:
- Locate 0.2 along the z column
- Locate 0 along the Second decimal place of z
- The intersection of row and column gives the probability value of 0.4207.
Use Table 4: Normal Curve Areas Standard normal probability in right-hand tail to obtain the probability as follows:
- Locate 1.5 along the z column
- Locate 6 along the Second decimal place of z
- The intersection of row and column gives the probability value of 0.0594.
Thus, The value of
f.
Find the value of
Explain the values given on the two horizontal axes identical or not.
Answer to Problem 58E
The value of
Explanation of Solution
Calculation:
The following can be observed for Z:
Step-by-step procedure to obtain the probability value using Applets as follows:
- Enter Mean = 0 and StDev = 1 values in the provided boxes.
- Enter Start = 0 and End = 1.2 value in the provided boxes.
Output obtained using Applets software is represented as follows:
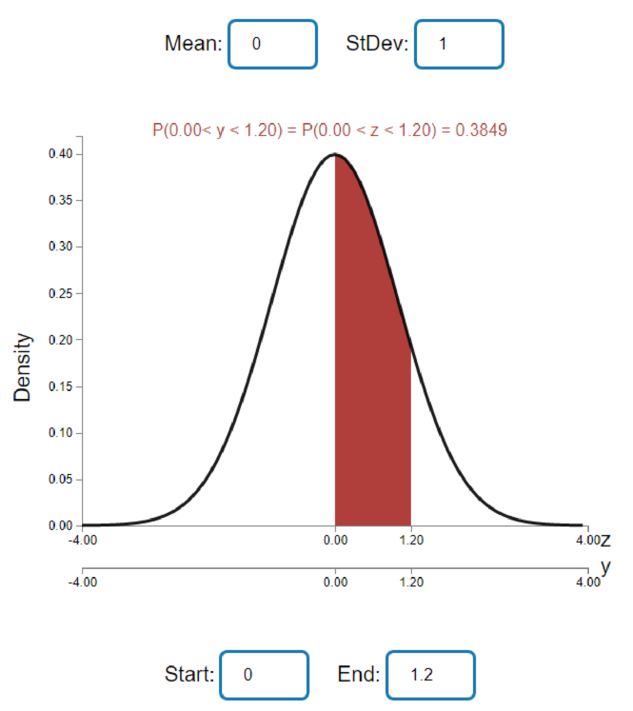
From the above output, the value of
Thus, the value of
Explanation:
The values given on the two horizontal axes are identical. It is because, in the above output the top Z axes represent the standard normal variable and they y axes represents the variable of interest. In the given situation the standard normal variable is only used. Hence as a result the both axes provide the same Z value of
Want to see more full solutions like this?
Chapter 4 Solutions
Mathematical Statistics with Applications


 Calculus For The Life SciencesCalculusISBN:9780321964038Author:GREENWELL, Raymond N., RITCHEY, Nathan P., Lial, Margaret L.Publisher:Pearson Addison Wesley,