
Concept explainers
Videos
Scattergraph, High-Low Method, and Predicting Cost for a Different Time Period from the One Used to Develop a Cost Formula
Refer to the information for Farnsworth Company on the previous page.
Required:
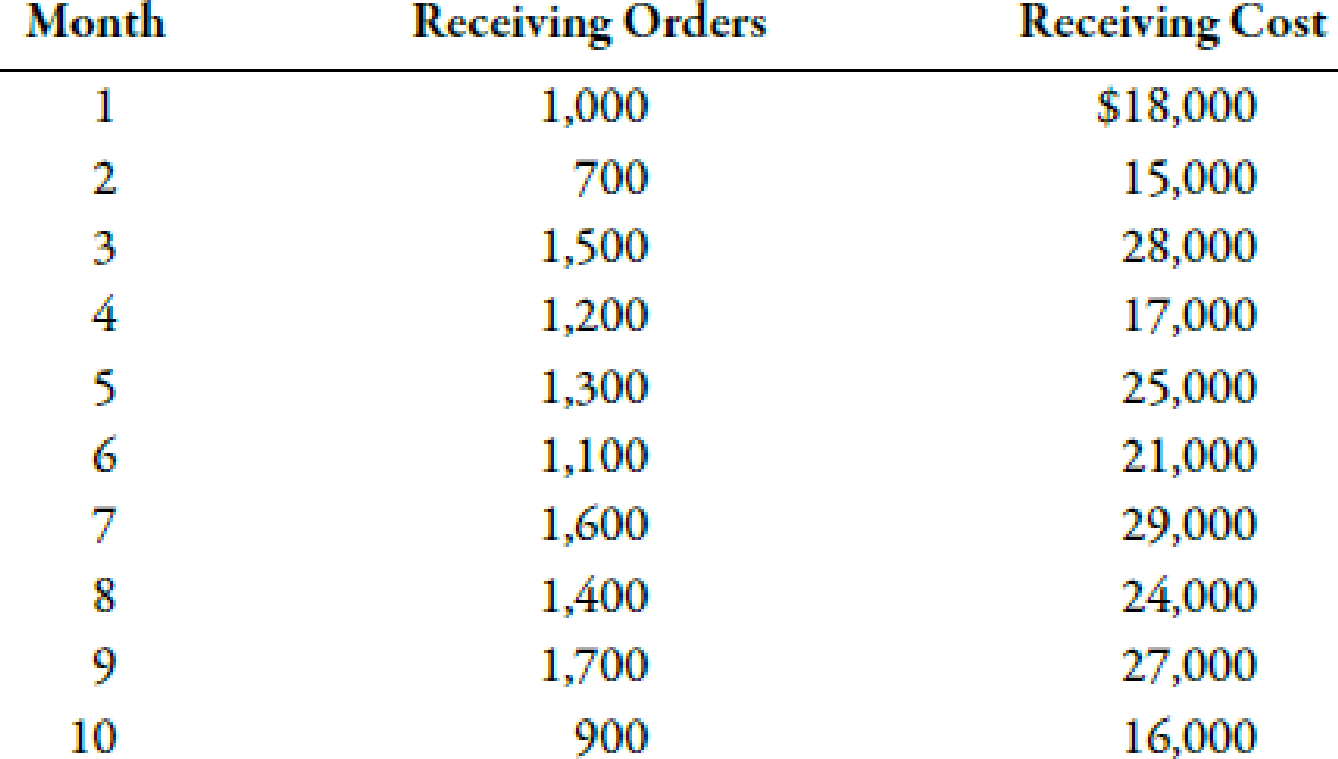
- 1. Prepare a scattergraph based on the 10 months of data. Does the relationship appear to be linear?
- 2. Using the high-low method, prepare a cost formula for the receiving activity. Using this formula, what is the predicted cost of receiving for a month in which 1,450 receiving orders are processed?
- 3. Prepare a cost formula for the receiving activity for a quarter. Based on this formula, what is the predicted cost of receiving for a quarter in which 4,650 receiving orders are anticipated? Prepare a cost formula for the receiving activity for a year. Based on this formula, what is the predicted cost of receiving for a year in which 18,000 receiving orders are anticipated?
Use the following information for Problems 3-60 and 3-61:
Farnsworth Company has gathered data on its overhead activities and associated costs for the past 10 months. Tracy Heppler, a member of the controller’s department, has convinced management that overhead costs can be better estimated and controlled if the fixed and variable components of each overhead activity are known. One such activity is receiving raw materials (unloading incoming goods, counting goods, and inspecting goods), which she believes is driven by the number of receiving orders. Ten months of data have been gathered for the receiving activity and are as follows:

Trending nowThis is a popular solution!

Chapter 3 Solutions
Managerial Accounting: The Cornerstone of Business Decision-Making


- Method of Least Squares, Predicting Cost for Different Time Periods from the One Used to Develop a Cost Formula Refer to the information for Farnsworth Company on the previous page. However, assume that Tracy has used the method of least squares on the receiving data and has gotten the following results: Required: 1. Using the results from the method of least squares, prepare a cost formula for the receiving activity. 2. Using the formula from Requirement 1, what is the predicted cost of receiving for a month in which 1,450 receiving orders are processed? (Note: Round your answer to the nearest dollar.) 3. Prepare a cost formula for the receiving activity for a quarter. Based on this formula, what is the predicted cost of receiving for a quarter in which 4,650 receiving orders are anticipated? Prepare a cost formula for the receiving activity for a year. Based on this formula, what is the predicted cost of receiving for a year in which 18,000 receiving orders are anticipated?arrow_forwardScattergraph method Using the data in P4-2 and a piece of graph paper: 1. Plot the data points on the graph and draw a line by visual inspection, indicating the trend shown by the data points. 2. Determine the variable cost per unit and the total fixed cost from the information on the graph. 3. Determine the variable cost to be charged to the product for the year. 4. Determine the fixed cost to be charged to factory overhead for the year. 5. Do these answers agree with the answers to P4-2? Why or why not?arrow_forwardUsing the data in P4-2 and Microsoft Excel: 1. Separate the variable and fixed elements. 2. Determine the cost to be charged to the product for the year. 3. Determine the cost to be charged to factory overhead for the year. 4. Determine the plotted data points using Chart Wizard. 5. Determine R2. 6. How do these solutions compare to the solutions in P4-2 and P4-3? 7. What does R2 tell you about this cost model?arrow_forward
- Using Regression to Calculate Fixed Cost, Calculate the Variable Rate, Construct a Cost Formula, and Determine Budgeted Cost Refer to the information for Speedy Petes on the previous page. Coefficients shown by a regression program for Speedy Petes data are: Required: Use the results of regression to make the following calculations: 1. Calculate the fixed cost of deliveries and the variable rate per delivery. 2. Construct the cost formula for total delivery cost. 3. Calculate the budgeted cost for next month, assuming that 3,000 deliveries are budgeted. (Note: Round answers to the nearest dollar.) Use the following information for Brief Exercises 3-26 through 3-29: Speedy Petes is a small start-up company that delivers high-end coffee drinks to large metropolitan office buildings via a cutting-edge motorized coffee cart to compete with other premium coffee shops. Data for the past 8 months were collected as follows:arrow_forwardData table Month Total Cost Machine Hours January.. 3,420 1,090 February..... S 3,760 1,120 March .... $ 3,532 1,080 April ..... 3,720 1,220 May S 4,800 1,330 June 4,192 1,480 .. %24 %24arrow_forwarda) Determine the variable cost per unit and the fixed cost using the high-low method. b) What is the equation of the total mixed cost function? c) Prepare the scatter diagram, clearly showing any outliers. d) Using the line of best-fit, determine the company’s fixed cost per month and the variable cost per unit. (Use 0 & 5,000 units.) e) In view of the department’s cost behavior pattern, which of the two methods appear more appropriate? Explain your answerarrow_forward
- Use the attached and calculate the below: Identify the fixed and variable costs associated with Cosgrove. Calculate the average costs per month.arrow_forwardThe graphs below represent cost behavior patterns that might occur in acompany's cost structure. The vertical axis represents total cost, and thehorizontal axis represents activity output. Required:For each of the following situations, choose the graph from the group a-1 that best illustrates the cost pattern involved. Also, for each situation,identify the driver that measures activity output. 1. The cost of power when a fixed fee of $500 per month is chargedplus an additional charge of $0.12 per kilowatt-hour used2. Commissions paid to sales representatives. Commissions arepaid at the rate of 5 percent of sales made up to total annual salesof $500,000, and 7 percent of sales above $500,000.3. A part purchased from an outside supplier costs $12 per part for the first 3,000 parts and $10 per part for all parts purchased inexcess of 3,000 units.4. The cost of surgical gloves, which are purchased in incrementsof 100 units (gloves come in boxes of 100 pairs).5. The cost of tuition at a…arrow_forwardQuestion: Use the high-low method to determine the estimating cost function with machine-hours as the cost If July's estimated machine-hours are 4,500, calculate the total estimated operating costs of the Machining Department using the cost function in (a)? Max has used least squares regression analysis to obtain the following output:arrow_forward
- 1. Prepare the scatter diagram, clearly showing any outliers. 2. Using the line of best-fit, determine the company’s fixed cost per month and the variable cost per unit.(Use 0 & 5,000 units.)arrow_forwardUse the high-low method to estimate the variable cost per tour mile traveled and the fixed cost per month. Develop a formula to express the cost behavior exhibited by the company’s maintenance cost. Round "Variable cost per tour mile" to 3 decimal places.arrow_forwardWrite a linear cost function equation for each of the following conditions. Use y for estimated costsand X for activity of the cost driver. Machine operating costs include $1,000 of maintenance per month, and $15.00 of coolant usagecosts for each day the machinery is in operation.arrow_forward
 Managerial Accounting: The Cornerstone of Busines...AccountingISBN:9781337115773Author:Maryanne M. Mowen, Don R. Hansen, Dan L. HeitgerPublisher:Cengage Learning
 Principles of Cost AccountingAccountingISBN:9781305087408Author:Edward J. Vanderbeck, Maria R. MitchellPublisher:Cengage Learning
 Excel Applications for Accounting PrinciplesAccountingISBN:9781111581565Author:Gaylord N. SmithPublisher:Cengage Learning
 Essentials of Business Analytics (MindTap Course ...StatisticsISBN:9781305627734Author:Jeffrey D. Camm, James J. Cochran, Michael J. Fry, Jeffrey W. Ohlmann, David R. AndersonPublisher:Cengage Learning