
Videos
| SMOLIRA GOLF. INC. 2016 Income Statement | |
| Sales | $205,227 |
| Cost of goods sold | 138,383 |
| Depreciation | 5,910 |
| EBIT | $ 60,934 |
| Interest paid | 1,617 |
| Taxable income | $ 59,317 |
| Taxes | 20,760 |
| Net income | $ 38,557 |
| Dividends | $14,300 |
| Additions to |
24,257 |
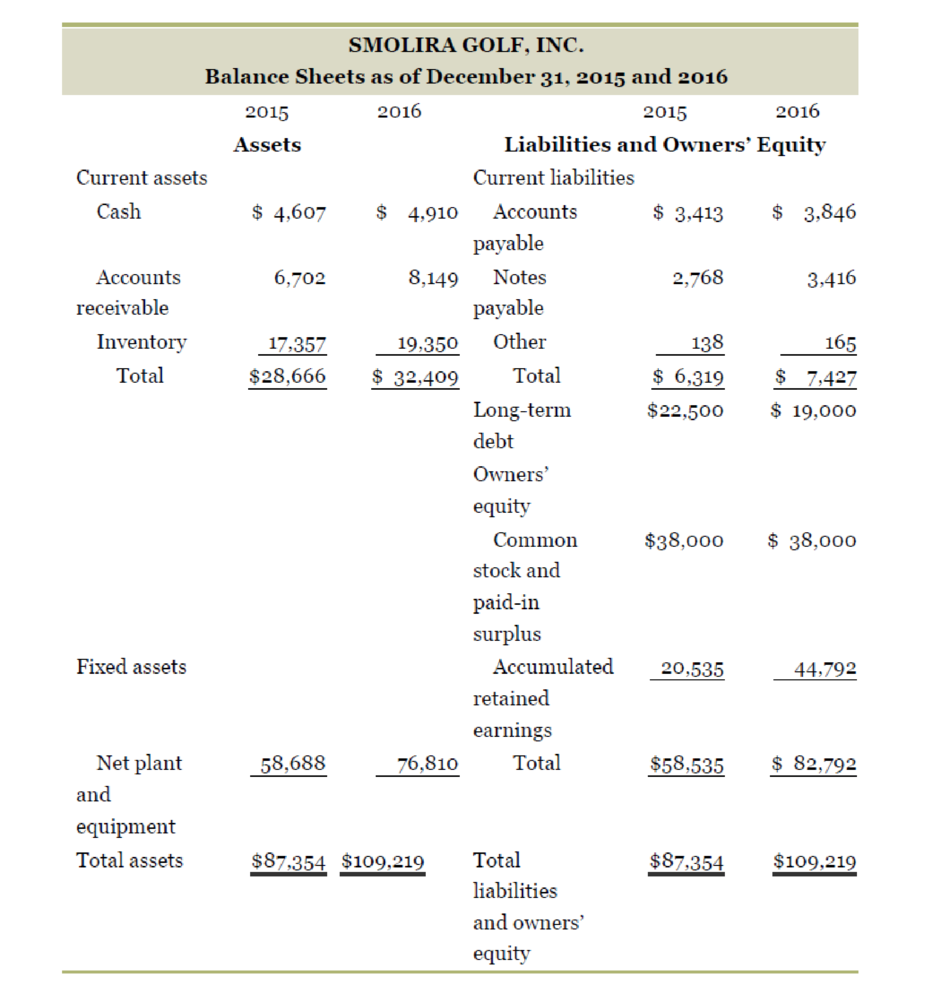
Calculating Financial Ratios. Find the following financial ratios for Smolira Golf (use year-end figures rather than average values where appropriate):
Short-term solvency ratios
a. Current ratio _____
b. Quick ratio _____
c. Cash ratio _____
Asset utilization ratios
d. Total asset turnover _____
e. Inventory turnover _____
f. Receivables turnover _____
Long-term solvency ratios
g. Total debt ratio _____
h. Debt–equity ratio _____
i. Equity multiplier _____
j. Times interest earned ratio _____
k. Cash coverage ratio _____
Profitability ratios
l. Profit margin _____
m.
n.
a)
To find: The financial ratios of Company SG
Introduction:
The process of analyzing and calculating the financial ratios for the evaluation of the performance of the firm and to find the actions that are necessary to improve the firm’s performance is the ratio analysis.
Explanation:
Given information:
The balance sheet of the Company SG shows the following information:
- The total assets for the year 2015 are $87,354 and for 2016 is $109,219.
- The total liabilities and equity for the year 2015 are $87,354 and for 2016 is $109,219.
- The cash at the beginning and end of the year are $4,607 and $4,910 respectively.
- The accounts receivable for the year 2015 and 2016 are $6,702 and $8,149 respectively.
- The inventory for the year 2015 and 2016 are $17,357 and $19,350 respectively.
- The fixed asset for the year 2015 and 2016 are $58,688 and $76,810 respectively.
- The accounts payable for the year 2015 and 2016 are $3,413 and $3,846 respectively.
- The other current liabilities for the year 2015 and 2016 are $138 and $165 respectively.
- The notes payable for the year 2015 and 2016 are $2,768 and $3,416 respectively.
- The long-term debt for the year 2015 and 2016 are $22,500 and $19,000.
- The common stock and paid in surplus for 2015 are $38,000 and for 2016 are $38,000.
- The accumulated retained earnings for 2015 are $20,535 and 2016 are $44,792.
- The net income is $38,557.
- The depreciation is $5,910.
- The dividend paid is $14,300.
- The cost of goods sold amounts to $138,383.
- The sales are $205,227.
- The earnings before interest and taxes are $60,934.
- The interest paid is $1,617.
- The addition to retained earnings is $24,257.
- The taxable income is $59,317.
Explanation of Solution
Formula to calculate the current ratio:
Compute the current ratio:
Hence, the current ratio for 2015 is 4.54 times.
Hence, the current ratio for 2016 is 4.36 times.
b)
To find: The financial ratios of Company SG
Introduction:
The process of analyzing and calculating the financial ratios for the evaluation of the performance of the firm and to find the actions that are necessary to improve the firm’s performance is the ratio analysis.
Explanation:
Given information:
The balance sheet of the Company SG shows the following information:
- The total assets for the year 2015 are $87,354 and for 2016 is $109,219.
- The total liabilities and equity for the year 2015 are $87,354 and for 2016 is $109,219.
- The cash at the beginning and end of the year are $4,607 and $4,910 respectively.
- The accounts receivable for the year 2015 and 2016 are $6,702 and $8,149 respectively.
- The inventory for the year 2015 and 2016 are $17,357 and $19,350 respectively.
- The fixed asset for the year 2015 and 2016 are $58,688 and $76,810 respectively.
- The accounts payable for the year 2015 and 2016 are $3,413 and $3,846 respectively.
- The other current liabilities for the year 2015 and 2016 are $138 and $165 respectively.
- The notes payable for the year 2015 and 2016 are $2,768 and $3,416 respectively.
- The long-term debt for the year 2015 and 2016 are $22,500 and $19,000.
- The common stock and paid in surplus for 2015 are $38,000 and for 2016 are $38,000.
- The accumulated retained earnings for 2015 are $20,535 and 2016 are $44,792.
- The net income is $38,557.
- The depreciation is $5,910.
- The dividend paid is $14,300.
- The cost of goods sold amounts to $138,383.
- The sales are $205,227.
- The earnings before interest and taxes are $60,934.
- The interest paid is $1,617.
- The addition to retained earnings is $24,257.
- The taxable income is $59,317.
Explanation of Solution
Formula to calculate Quick ratio:
Compute the quick ratio:
Hence, the quick ratio for 2015 is 1.79 times.
Hence, the quick ratio for 2016 is 1.76 times.
c)
To find: The financial ratios of Company SG
Introduction:
The process of analyzing and calculating the financial ratios for the evaluation of the performance of the firm and to find the actions that are necessary to improve the firm’s performance is the ratio analysis.
Explanation:
Given information:
The balance sheet of the Company SG shows the following information:
- The total assets for the year 2015 are $87,354 and for 2016 is $109,219.
- The total liabilities and equity for the year 2015 are $87,354 and for 2016 is $109,219.
- The cash at the beginning and end of the year are $4,607 and $4,910 respectively.
- The accounts receivable for the year 2015 and 2016 are $6,702 and $8,149 respectively.
- The inventory for the year 2015 and 2016 are $17,357 and $19,350 respectively.
- The fixed asset for the year 2015 and 2016 are $58,688 and $76,810 respectively.
- The accounts payable for the year 2015 and 2016 are $3,413 and $3,846 respectively.
- The other current liabilities for the year 2015 and 2016 are $138 and $165 respectively.
- The notes payable for the year 2015 and 2016 are $2,768 and $3,416 respectively.
- The long-term debt for the year 2015 and 2016 are $22,500 and $19,000.
- The common stock and paid in surplus for 2015 are $38,000 and for 2016 are $38,000.
- The accumulated retained earnings for 2015 are $20,535 and 2016 are $44,792.
- The net income is $38,557.
- The depreciation is $5,910.
- The dividend paid is $14,300.
- The cost of goods sold amounts to $138,383.
- The sales are $205,227.
- The earnings before interest and taxes are $60,934.
- The interest paid is $1,617.
- The addition to retained earnings is $24,257.
- The taxable income is $59,317.
Explanation of Solution
Formula to calculate the cash ratio:
Compute the cash ratio:
Hence, the cash ratio for 2015 is 0.73 times.
Hence, the cash ratio for 2016 is 0.42 times.
d)
To find: The financial ratios of Company SG
Introduction:
The process of analyzing and calculating the financial ratios for the evaluation of the performance of the firm and to find the actions that are necessary to improve the firm’s performance is the ratio analysis.
Explanation:
Given information:
The balance sheet of the Company SG shows the following information:
- The total assets for the year 2015 are $87,354 and for 2016 is $109,219.
- The total liabilities and equity for the year 2015 are $87,354 and for 2016 is $109,219.
- The cash at the beginning and end of the year are $4,607 and $4,910 respectively.
- The accounts receivable for the year 2015 and 2016 are $6,702 and $8,149 respectively.
- The inventory for the year 2015 and 2016 are $17,357 and $19,350 respectively.
- The fixed asset for the year 2015 and 2016 are $58,688 and $76,810 respectively.
- The accounts payable for the year 2015 and 2016 are $3,413 and $3,846 respectively.
- The other current liabilities for the year 2015 and 2016 are $138 and $165 respectively.
- The notes payable for the year 2015 and 2016 are $2,768 and $3,416 respectively.
- The long-term debt for the year 2015 and 2016 are $22,500 and $19,000.
- The common stock and paid in surplus for 2015 are $38,000 and for 2016 are $38,000.
- The accumulated retained earnings for 2015 are $20,535 and 2016 are $44,792.
- The net income is $38,557.
- The depreciation is $5,910.
- The dividend paid is $14,300.
- The cost of goods sold amounts to $138,383.
- The sales are $205,227.
- The earnings before interest and taxes are $60,934.
- The interest paid is $1,617.
- The addition to retained earnings is $24,257.
- The taxable income is $59,317.
Explanation of Solution
Formula to calculate the total asset turnover ratio:
Compute the total asset turnover ratio:
Hence, the total asset turnover ratio is 1.88 times.
e)
To find: The financial ratios of Company SG
Introduction:
The process of analyzing and calculating the financial ratios for the evaluation of the performance of the firm and to find the actions that are necessary to improve the firm’s performance is the ratio analysis.
Explanation:
Given information:
The balance sheet of the Company SG shows the following information:
- The total assets for the year 2015 are $87,354 and for 2016 is $109,219.
- The total liabilities and equity for the year 2015 are $87,354 and for 2016 is $109,219.
- The cash at the beginning and end of the year are $4,607 and $4,910 respectively.
- The accounts receivable for the year 2015 and 2016 are $6,702 and $8,149 respectively.
- The inventory for the year 2015 and 2016 are $17,357 and $19,350 respectively.
- The fixed asset for the year 2015 and 2016 are $58,688 and $76,810 respectively.
- The accounts payable for the year 2015 and 2016 are $3,413 and $3,846 respectively.
- The other current liabilities for the year 2015 and 2016 are $138 and $165 respectively.
- The notes payable for the year 2015 and 2016 are $2,768 and $3,416 respectively.
- The long-term debt for the year 2015 and 2016 are $22,500 and $19,000.
- The common stock and paid in surplus for 2015 are $38,000 and for 2016 are $38,000.
- The accumulated retained earnings for 2015 are $20,535 and 2016 are $44,792.
- The net income is $38,557.
- The depreciation is $5,910.
- The dividend paid is $14,300.
- The cost of goods sold amounts to $138,383.
- The sales are $205,227.
- The earnings before interest and taxes are $60,934.
- The interest paid is $1,617.
- The addition to retained earnings is $24,257.
- The taxable income is $59,317.
Explanation of Solution
Formula to calculate the inventory turnover ratio:
Compute the inventory turnover ratio:
Hence, the inventory turnover ratio is 7.15 times.
f)
To find: The financial ratios of Company SG
Introduction:
The process of analyzing and calculating the financial ratios for the evaluation of the performance of the firm and to find the actions that are necessary to improve the firm’s performance is the ratio analysis.
Explanation:
Given information:
The balance sheet of the Company SG shows the following information:
- The total assets for the year 2015 are $87,354 and for 2016 is $109,219.
- The total liabilities and equity for the year 2015 are $87,354 and for 2016 is $109,219.
- The cash at the beginning and end of the year are $4,607 and $4,910 respectively.
- The accounts receivable for the year 2015 and 2016 are $6,702 and $8,149 respectively.
- The inventory for the year 2015 and 2016 are $17,357 and $19,350 respectively.
- The fixed asset for the year 2015 and 2016 are $58,688 and $76,810 respectively.
- The accounts payable for the year 2015 and 2016 are $3,413 and $3,846 respectively.
- The other current liabilities for the year 2015 and 2016 are $138 and $165 respectively.
- The notes payable for the year 2015 and 2016 are $2,768 and $3,416 respectively.
- The long-term debt for the year 2015 and 2016 are $22,500 and $19,000.
- The common stock and paid in surplus for 2015 are $38,000 and for 2016 are $38,000.
- The accumulated retained earnings for 2015 are $20,535 and 2016 are $44,792.
- The net income is $38,557.
- The depreciation is $5,910.
- The dividend paid is $14,300.
- The cost of goods sold amounts to $138,383.
- The sales are $205,227.
- The earnings before interest and taxes are $60,934.
- The interest paid is $1,617.
- The addition to retained earnings is $24,257.
- The taxable income is $59,317.
Explanation of Solution
Formula to calculate the receivables turnover ratio:
Compute the receivables turnover ratio:
Hence, the receivables turnover ratio is 25.18 times.
g)
To find: The financial ratios of Company SG
Introduction:
The process of analyzing and calculating the financial ratios for the evaluation of the performance of the firm and to find the actions that are necessary to improve the firm’s performance is the ratio analysis.
Explanation:
Given information:
The balance sheet of the Company SG shows the following information:
- The total assets for the year 2015 are $87,354 and for 2016 is $109,219.
- The total liabilities and equity for the year 2015 are $87,354 and for 2016 is $109,219.
- The cash at the beginning and end of the year are $4,607 and $4,910 respectively.
- The accounts receivable for the year 2015 and 2016 are $6,702 and $8,149 respectively.
- The inventory for the year 2015 and 2016 are $17,357 and $19,350 respectively.
- The fixed asset for the year 2015 and 2016 are $58,688 and $76,810 respectively.
- The accounts payable for the year 2015 and 2016 are $3,413 and $3,846 respectively.
- The other current liabilities for the year 2015 and 2016 are $138 and $165 respectively.
- The notes payable for the year 2015 and 2016 are $2,768 and $3,416 respectively.
- The long-term debt for the year 2015 and 2016 are $22,500 and $19,000.
- The common stock and paid in surplus for 2015 are $38,000 and for 2016 are $38,000.
- The accumulated retained earnings for 2015 are $20,535 and 2016 are $44,792.
- The net income is $38,557.
- The depreciation is $5,910.
- The dividend paid is $14,300.
- The cost of goods sold amounts to $138,383.
- The sales are $205,227.
- The earnings before interest and taxes are $60,934.
- The interest paid is $1,617.
- The addition to retained earnings is $24,257.
- The taxable income is $59,317.
Explanation of Solution
Formula to calculate the total debt ratio:
Compute the total debt ratio:
Hence, the total debt ratio for 2015 is 0.33 times.
Hence, the total debt ratio for 2016 is 0.24 times.
h)
To find: The financial ratios of Company SG
Introduction:
The process of analyzing and calculating the financial ratios for the evaluation of the performance of the firm and to find the actions that are necessary to improve the firm’s performance is the ratio analysis.
Explanation:
Given information:
The balance sheet of the Company SG shows the following information:
- The total assets for the year 2015 are $87,354 and for 2016 is $109,219.
- The total liabilities and equity for the year 2015 are $87,354 and for 2016 is $109,219.
- The cash at the beginning and end of the year are $4,607 and $4,910 respectively.
- The accounts receivable for the year 2015 and 2016 are $6,702 and $8,149 respectively.
- The inventory for the year 2015 and 2016 are $17,357 and $19,350 respectively.
- The fixed asset for the year 2015 and 2016 are $58,688 and $76,810 respectively.
- The accounts payable for the year 2015 and 2016 are $3,413 and $3,846 respectively.
- The other current liabilities for the year 2015 and 2016 are $138 and $165 respectively.
- The notes payable for the year 2015 and 2016 are $2,768 and $3,416 respectively.
- The long-term debt for the year 2015 and 2016 are $22,500 and $19,000.
- The common stock and paid in surplus for 2015 are $38,000 and for 2016 are $38,000.
- The accumulated retained earnings for 2015 are $20,535 and 2016 are $44,792.
- The net income is $38,557.
- The depreciation is $5,910.
- The dividend paid is $14,300.
- The cost of goods sold amounts to $138,383.
- The sales are $205,227.
- The earnings before interest and taxes are $60,934.
- The interest paid is $1,617.
- The addition to retained earnings is $24,257.
- The taxable income is $59,317.
Explanation of Solution
Formula to calculate the debt-equity ratio:
Compute the debt-equity:
Hence, the debt-equity ratio for the year 2015 is 0.49 times.
Hence, the debt-equity ratio for the year 2016 is 0.32 times.
Note: The total debt is calculated by adding the total-long term debt and total current liabilities.
i)
To find: The financial ratios of Company SG
Introduction:
The process of analyzing and calculating the financial ratios for the evaluation of the performance of the firm and to find the actions that are necessary to improve the firm’s performance is the ratio analysis.
Explanation:
Given information:
The balance sheet of the Company SG shows the following information:
- The total assets for the year 2015 are $87,354 and for 2016 is $109,219.
- The total liabilities and equity for the year 2015 are $87,354 and for 2016 is $109,219.
- The cash at the beginning and end of the year are $4,607 and $4,910 respectively.
- The accounts receivable for the year 2015 and 2016 are $6,702 and $8,149 respectively.
- The inventory for the year 2015 and 2016 are $17,357 and $19,350 respectively.
- The fixed asset for the year 2015 and 2016 are $58,688 and $76,810 respectively.
- The accounts payable for the year 2015 and 2016 are $3,413 and $3,846 respectively.
- The other current liabilities for the year 2015 and 2016 are $138 and $165 respectively.
- The notes payable for the year 2015 and 2016 are $2,768 and $3,416 respectively.
- The long-term debt for the year 2015 and 2016 are $22,500 and $19,000.
- The common stock and paid in surplus for 2015 are $38,000 and for 2016 are $38,000.
- The accumulated retained earnings for 2015 are $20,535 and 2016 are $44,792.
- The net income is $38,557.
- The depreciation is $5,910.
- The dividend paid is $14,300.
- The cost of goods sold amounts to $138,383.
- The sales are $205,227.
- The earnings before interest and taxes are $60,934.
- The interest paid is $1,617.
- The addition to retained earnings is $24,257.
- The taxable income is $59,317.
Explanation of Solution
Formula to calculate the equity multiplier:
Compute the equity multiplier ratio for the year 2015:
Hence, the equity multiplier ratio for the year 2015 is 1.49 times.
Hence, the equity multiplier ratio for the year 2016 is 1.32 times.
j)
To find: The financial ratios of Company SG
Introduction:
The process of analyzing and calculating the financial ratios for the evaluation of the performance of the firm and to find the actions that are necessary to improve the firm’s performance is the ratio analysis.
Explanation:
Given information:
The balance sheet of the Company SG shows the following information:
- The total assets for the year 2015 are $87,354 and for 2016 is $109,219.
- The total liabilities and equity for the year 2015 are $87,354 and for 2016 is $109,219.
- The cash at the beginning and end of the year are $4,607 and $4,910 respectively.
- The accounts receivable for the year 2015 and 2016 are $6,702 and $8,149 respectively.
- The inventory for the year 2015 and 2016 are $17,357 and $19,350 respectively.
- The fixed asset for the year 2015 and 2016 are $58,688 and $76,810 respectively.
- The accounts payable for the year 2015 and 2016 are $3,413 and $3,846 respectively.
- The other current liabilities for the year 2015 and 2016 are $138 and $165 respectively.
- The notes payable for the year 2015 and 2016 are $2,768 and $3,416 respectively.
- The long-term debt for the year 2015 and 2016 are $22,500 and $19,000.
- The common stock and paid in surplus for 2015 are $38,000 and for 2016 are $38,000.
- The accumulated retained earnings for 2015 are $20,535 and 2016 are $44,792.
- The net income is $38,557.
- The depreciation is $5,910.
- The dividend paid is $14,300.
- The cost of goods sold amounts to $138,383.
- The sales are $205,227.
- The earnings before interest and taxes are $60,934.
- The interest paid is $1,617.
- The addition to retained earnings is $24,257.
- The taxable income is $59,317.
Explanation of Solution
Formula to calculate the times interest earned ratio:
Compute the times interest earned ratio:
Hence, the times interest earned is 37.68 times.
k)
To find: The financial ratios of Company SG
Introduction:
The process of analyzing and calculating the financial ratios for the evaluation of the performance of the firm and to find the actions that are necessary to improve the firm’s performance is the ratio analysis.
Explanation:
Given information:
The balance sheet of the Company SG shows the following information:
- The total assets for the year 2015 are $87,354 and for 2016 is $109,219.
- The total liabilities and equity for the year 2015 are $87,354 and for 2016 is $109,219.
- The cash at the beginning and end of the year are $4,607 and $4,910 respectively.
- The accounts receivable for the year 2015 and 2016 are $6,702 and $8,149 respectively.
- The inventory for the year 2015 and 2016 are $17,357 and $19,350 respectively.
- The fixed asset for the year 2015 and 2016 are $58,688 and $76,810 respectively.
- The accounts payable for the year 2015 and 2016 are $3,413 and $3,846 respectively.
- The other current liabilities for the year 2015 and 2016 are $138 and $165 respectively.
- The notes payable for the year 2015 and 2016 are $2,768 and $3,416 respectively.
- The long-term debt for the year 2015 and 2016 are $22,500 and $19,000.
- The common stock and paid in surplus for 2015 are $38,000 and for 2016 are $38,000.
- The accumulated retained earnings for 2015 are $20,535 and 2016 are $44,792.
- The net income is $38,557.
- The depreciation is $5,910.
- The dividend paid is $14,300.
- The cost of goods sold amounts to $138,383.
- The sales are $205,227.
- The earnings before interest and taxes are $60,934.
- The interest paid is $1,617.
- The addition to retained earnings is $24,257.
- The taxable income is $59,317.
Explanation of Solution
Formula to calculate the cash coverage ratio:
Compute the cash coverage ratio:
Hence, the cash coverage ratio is 41.34 times.
l)
To find: The financial ratios of Company SG
Introduction:
The process of analyzing and calculating the financial ratios for the evaluation of the performance of the firm and to find the actions that are necessary to improve the firm’s performance is the ratio analysis.
Explanation:
Given information:
The balance sheet of the Company SG shows the following information:
- The total assets for the year 2015 are $87,354 and for 2016 is $109,219.
- The total liabilities and equity for the year 2015 are $87,354 and for 2016 is $109,219.
- The cash at the beginning and end of the year are $4,607 and $4,910 respectively.
- The accounts receivable for the year 2015 and 2016 are $6,702 and $8,149 respectively.
- The inventory for the year 2015 and 2016 are $17,357 and $19,350 respectively.
- The fixed asset for the year 2015 and 2016 are $58,688 and $76,810 respectively.
- The accounts payable for the year 2015 and 2016 are $3,413 and $3,846 respectively.
- The other current liabilities for the year 2015 and 2016 are $138 and $165 respectively.
- The notes payable for the year 2015 and 2016 are $2,768 and $3,416 respectively.
- The long-term debt for the year 2015 and 2016 are $22,500 and $19,000.
- The common stock and paid in surplus for 2015 are $38,000 and for 2016 are $38,000.
- The accumulated retained earnings for 2015 are $20,535 and 2016 are $44,792.
- The net income is $38,557.
- The depreciation is $5,910.
- The dividend paid is $14,300.
- The cost of goods sold amounts to $138,383.
- The sales are $205,227.
- The earnings before interest and taxes are $60,934.
- The interest paid is $1,617.
- The addition to retained earnings is $24,257.
- The taxable income is $59,317.
Explanation of Solution
Formula to calculate the profit margin ratio:
Compute the profit margin:
Hence, the profit margin is 18.79%.
m)
To find: The financial ratios of Company SG
Introduction:
The process of analyzing and calculating the financial ratios for the evaluation of the performance of the firm and to find the actions that are necessary to improve the firm’s performance is the ratio analysis.
Explanation:
Given information:
The balance sheet of the Company SG shows the following information:
- The total assets for the year 2015 are $87,354 and for 2016 is $109,219.
- The total liabilities and equity for the year 2015 are $87,354 and for 2016 is $109,219.
- The cash at the beginning and end of the year are $4,607 and $4,910 respectively.
- The accounts receivable for the year 2015 and 2016 are $6,702 and $8,149 respectively.
- The inventory for the year 2015 and 2016 are $17,357 and $19,350 respectively.
- The fixed asset for the year 2015 and 2016 are $58,688 and $76,810 respectively.
- The accounts payable for the year 2015 and 2016 are $3,413 and $3,846 respectively.
- The other current liabilities for the year 2015 and 2016 are $138 and $165 respectively.
- The notes payable for the year 2015 and 2016 are $2,768 and $3,416 respectively.
- The long-term debt for the year 2015 and 2016 are $22,500 and $19,000.
- The common stock and paid in surplus for 2015 are $38,000 and for 2016 are $38,000.
- The accumulated retained earnings for 2015 are $20,535 and 2016 are $44,792.
- The net income is $38,557.
- The depreciation is $5,910.
- The dividend paid is $14,300.
- The cost of goods sold amounts to $138,383.
- The sales are $205,227.
- The earnings before interest and taxes are $60,934.
- The interest paid is $1,617.
- The addition to retained earnings is $24,257.
- The taxable income is $59,317.
Explanation of Solution
Formula to calculate the Return on assets (ROA):
Compute the Return on assets (ROA):
Hence, the return on assets is 35.30%.
n)
To find: The financial ratios of Company SG
Introduction:
The process of analyzing and calculating the financial ratios for the evaluation of the performance of the firm and to find the actions that are necessary to improve the firm’s performance is the ratio analysis.
Explanation:
Given information:
The balance sheet of the Company SG shows the following information:
- The total assets for the year 2015 are $87,354 and for 2016 is $109,219.
- The total liabilities and equity for the year 2015 are $87,354 and for 2016 is $109,219.
- The cash at the beginning and end of the year are $4,607 and $4,910 respectively.
- The accounts receivable for the year 2015 and 2016 are $6,702 and $8,149 respectively.
- The inventory for the year 2015 and 2016 are $17,357 and $19,350 respectively.
- The fixed asset for the year 2015 and 2016 are $58,688 and $76,810 respectively.
- The accounts payable for the year 2015 and 2016 are $3,413 and $3,846 respectively.
- The other current liabilities for the year 2015 and 2016 are $138 and $165 respectively.
- The notes payable for the year 2015 and 2016 are $2,768 and $3,416 respectively.
- The long-term debt for the year 2015 and 2016 are $22,500 and $19,000.
- The common stock and paid in surplus for 2015 are $38,000 and for 2016 are $38,000.
- The accumulated retained earnings for 2015 are $20,535 and 2016 are $44,792.
- The net income is $38,557.
- The depreciation is $5,910.
- The dividend paid is $14,300.
- The cost of goods sold amounts to $138,383.
- The sales are $205,227.
- The earnings before interest and taxes are $60,934.
- The interest paid is $1,617.
- The addition to retained earnings is $24,257.
- The taxable income is $59,317.
Explanation of Solution
Formulae to calculate the Return on equity (ROE):
Compute the Return on equity (ROE):
Hence, the return on equity is 0.4657 or 46.57%.
Want to see more full solutions like this?
Chapter 3 Solutions
Essentials of Corporate Finance (Mcgraw-hill/Irwin Series in Finance, Insurance, and Real Estate)


- Juroe Company provided the following income statement for last year: Juroes balance sheet as of December 31 last year showed total liabilities of 10,250,000, total equity of 6,150,000, and total assets of 16,400,000. Required: Note: Round answers to two decimal places. 1. Calculate the times-interest-earned ratio. 2. Calculate the debt ratio. 3. Calculate the debt-to-equity ratio.arrow_forwardCalculating Ratios and Estimating Credit Rating The following data are from Kellogg's 10-K report dated December 29, 2018 ($ millions). Revenue Interest expense Tax expense Amortization expense Depreciation expense $13,547 Earnings from continuing operations $1,344 Capital expenditures (CAPEX) 578 287 181 Total debt 8,893 23 Average assets 17,066 493 a. Use the data above to calculate the following ratios: EBITA/Average assets, EBITA Margin, EBITA/ Interest expense, Debt/EBITDA, CAPEX/Depreciation Expense. Definitions for these ratios are in Exhibit 7.4. b. Refer to Exhibit 7.4 and the ratios you calculated in part a. Estimate the credit rating that Moody's might assign to Kellogg. Round answers to one decimal place (percentage ex: 0.2345 = 23.5%) Ratio Moody's rating EBITA/Avg. assets EBITA margin EBITA/Int. expense Debt/EBITDA CAPEX/Dep. expense Please answer all parts of the question. 0% 0% 0 0 0 ◆ ◆arrow_forwardSome recent financial statements for Smolira Golf Corporation follow. Assets Current assets Cash Accounts receivable Inventory Total Fixed assets Net plant and equipment Total assets Sales Cost of goods sold Depreciation Taxable income Taxes (22%) Earnings before interest and taxes Interest paid Net income Dividends Retained earnings 2020 $35,585 $38,940 28,846 43,112 18,401 3,970 SMOLIRA GOLF CORPORATION 2021 Income Statement a. Price-earnings ratio b. Dividends per share c. Market-to-book ratio d. PEG ratio SMOLIRA GOLF CORPORATION 2020 and 2021 Balance Sheets 2021 Liabilities and Owners' Equity Current liabilities $57,956 $110,898 $ 465,585 $ 27,000 37,022 Accounts payable Notes payable Other $ 521,433 Total $ 523,541 $ 632,331 Total liabilities and owners' equity Long-term debt times Owners' equity Common stock and paid-in surplus Accumulated retained earnings times times Total $ 512,454 363,528 45,963 $102,963 20,883 $ 82,080 18,058 $ 64,022 Smolira Golf Corporation has 52,000…arrow_forward
- Find the following financial ratios for LVMH Moet Hennessy Louis Vuitton SA (use year-end figures rather than average values where appropriate) (Round your answers to 2 decimal places (e.g., 32.16).) : 2015 2016 Short-term solvency ratios: Current ratio Quick ratio Cash ratio Asset utilization ratios: Total asset turnover Inventory turnover Receivables turnover Long-term solvency ratios: Total debt ratio Debt–equity ratio Equity multiplier Times interest earned ratio Profitability ratios: Profit margin % % Return on assets % % Return on equity % %arrow_forwardNot Graded Using the fiscal year end 2020 annual report for General Mills, Inc. and the figures from the 2020 annual report as noted below, calculate the financial ratios for 2020 and 2019 indicated using the EXCEL template provided:1. Gross profit percentage2. Return on sales3. Asset turnover 4. Return on assets5. Return on common stockholders’ equity6. Current ratio7. Quick ratio8. Operating-cash-flow-to-current-liabilities ratio9. Accounts receivable turnoverTotal assets 2020 = $30,806.7Total stockholders’ equity 2020 = $8,349.5Total current liabilities 2020 = $7,491.5Accounts receivable 2020 = $1,615.1Inventory 2020 = $1,426.3Year-end closing stock price May 2020 = $58.80Year-end closing stock price May 2019 = $53.56arrow_forwardOperating data for Flounder Corp. are presented below. 2017 2016 Sales revenue $825,400 $628,400 Cost of goods sold 527,300 412,700 Selling expenses 125,600 76,800 Administrative expenses 75,500 52,800 Income tax expense 36,700 29,200 Net income 60,300 56,900 Prepare a schedule showing a vertical analysis for 2017 and 2016. (Round percentages to 1 decimal place, e.g. 12.1%.)arrow_forward
- Some recent financial statements for Smolira Golf, Inc., follow. SMOLIRA GOLF, INC. Balance Sheets as of December 31, 2018 and 2019 2018 2019 2018 2019 Assets Liabilities and Owners' Equity Current assets Current liabilities $ 3,271 $ 3,457 4,782 5,811 13,812 12,418 Accounts payable Notes payable $ 2,138 $ 2,570 2,086 104 Cash Accounts receivable 1,735 Inventory Other 87 Total $ 20,471 $23,080 Total $ 3,960 $ 4,760 $ 13,700 $16,460 Long-term debt Owners' equity Common stock 36,500 and paid-in surplus $36,500 $ Accumulated retained 38,893 Fixed assets 15,639 earnings 75,393 Net plant and equipment $ 52,139 $ $49,328 $73,533 Total Total liabilities and owners' Total assets $69,799 $ 96,613 $ 69,799 $96,613 equityarrow_forwardUse the following tables to answer the question: LOGIC COMPANY Income Statement For years ended December 31, 2016 and 2017 (values in $) 2016 2017 Gross sales 19,800 15,600 Sales returns and allowances 900 100 Net sales 18,900 15,500 COGS 11,800 8,800 Gross profit 7,100 6,700 Depreciation 780 640 Selling and administrative expenses 2,800 2,400 Research 630 540 Miscellaneous 440 340 Total operating expenses 4,650 3,920 Income before interest and taxes 2,450 2,780 Interest expense 640 540 Income before taxes 1,810 2,240 Provision for taxes 724 896 LOGIC COMPANY Balance Sheet For years ended December 31, 2016 and 2017 (values in $) 2016 2017 Current assets 12,300 9,400 Accounts receivable 16,900 12,900 Merchandise inventory 8,900 14,400 Prepaid expenses 24,400 10,400 Total current assets 62,500 47,100 Building (net) 14,900 11,400 Land 13,900 9,400 Total plant and equipment 28,800 20,800 Total assets 91,300 67,900 Accounts payable 13,400 7,400 Salaries payable 7,500 5,400 Total current…arrow_forwardUsing the fiscal year end 2019 annual report for General Mills, Inc. and the figures from the 2017 annual report as noted below, calculate the financial ratios for 2019 and 2018 indicated using the EXCEL template provided: Gross profit percentage Return on sales Asset turnover Return on assets Return on common stockholders’ equity Current ratio Quick ratio Operating-cash-flow-to-current-liabilities ratio 9. Accounts receivable turnover Total assets 2017 = $21,812.6 Total stockholders’ equity 2017 = $4,327.9 Total current liabilities 2017 = $5,330.8 Accounts receivable 2017 = $1,430.1 Inventory 2017 = $1,483.6 Year-end closing stock price May 2019 = $50.93 Year-end closing stock price May 2018 = $39.37arrow_forward
- All-Hands Property & Casualty Insurance Company has the following financial ratios. 2019 2018 Loss Ratio 67.8 68.1 Expense Ratio 24.2 25.1 Net Investment Yield 3.5 4.0 a. Calculate the Combined Ratio {Loss Ratio + Expense Ratio} for each year. Combined Ratio 2019 Combined Ratio 2018 b. Calculate the Overall Profitability Ratios Overall Profitability Ratio 2019 Overall Profitability Ratio 2018 why the Overall Profitability Ratio Changed in 2019 Based on the Loss Ratio, Expense Ratio, and Net Investment Yield Trends?arrow_forwardThe following ratios have been computed for Pina Colada Company for 2022. Profit margin ratio 20 % Current ratio 2.5 :1 Times interest earned 12 times Debt to assets ratio 24 % Accounts receivable turnover 5 times Use the above ratios and information from the Pina Colada Company financial statements to fill in the missing information on the financial statements.The 2022 financial statements for Pina Colada Company with missing information follows: (Include calculations) PINA COLADA COMPANYComparative Balance SheetDecember 31, 2022 2021 Assets Cash $ 26,500 $ 37,100 Debt Investments 15,900 15,900 Accounts receivable (net) 53,000 Inventory 53,000 Property, plant, and equipment (net) 212,000 169,600 Total assets Liabilities and stockholders' equity Accounts payable $ 15,900 $ 26,500 Short-term notes payable 37,100 31,800 Bonds payable Enter…arrow_forwardUsing the fiscal year end 2020 annual report for General Mills, Inc. and the figures from the 2020 annual report as noted below, calculate the financial ratios for 2020 and 2019 indicated using the EXCEL template provided:1. Gross profit percentage2. Return on sales3. Asset turnover 4. Return on assets5. Return on common stockholders’ equity6. Current ratio7. Quick ratio8. Operating-cash-flow-to-current-liabilities ratio9. Accounts receivable turnoverTotal assets 2020 = $30,806.7Total stockholders’ equity 2020 = $8,349.5Total current liabilities 2020 = $7,491.5Accounts receivable 2020 = $1,615.1Inventory 2020 = $1,426.3Year-end closing stock price May 2020 = $58.80Year-end closing stock price May 2019 = $53.56 To calculate averages use (current year balance + poor year balance) / 2) Round percentages to 1 decimal place; round other answers to 2 decimal places.arrow_forward
 Financial Accounting: The Impact on Decision Make...AccountingISBN:9781305654174Author:Gary A. Porter, Curtis L. NortonPublisher:Cengage Learning
 Managerial Accounting: The Cornerstone of Busines...AccountingISBN:9781337115773Author:Maryanne M. Mowen, Don R. Hansen, Dan L. HeitgerPublisher:Cengage Learning