
Concept explainers
Videos
(a)
Section 1:
The 20 simple random samples of size 5 and record the number of females in each sample.
(a)
Section 1:
Answer to Problem 13E
Solution: The partial output of the 20 simple random samples is shown below:
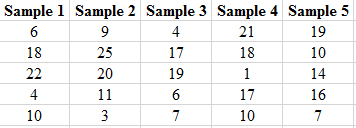
The number of females in each sample is shown below.
| Samples | Number of females | Samples | Number of females |
| Sample 1 | 2 | Sample 11 | 1 |
| Sample 2 | 1 | Sample 12 | 2 |
| Sample 3 | 2 | Sample 13 | 4 |
| Sample 4 | 3 | Sample 14 | 2 |
| Sample 5 | 1 | Sample 15 | 3 |
| Sample 6 | 2 | Sample 16 | 2 |
| Sample 7 | 3 | Sample 17 | 0 |
| Sample 8 | 1 | Sample 18 | 2 |
| Sample 9 | 1 | Sample 19 | 1 |
| Sample 10 | 2 | Sample 20 | 2 |
Explanation of Solution
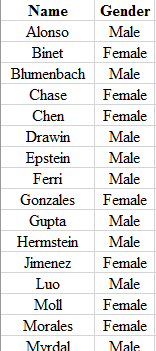
Step 1: Write the name and the gender of the club members in the Excel spreadsheet. The snapshot is shown below:
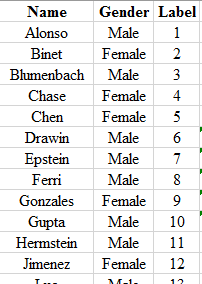
Step 2: Label each of the members using the numbers
Step 3: Use the formula

To find the number of female in each sample, the label of each female member is matched with the obtained random number of each set of sample and then the number of female is counted. The number of females obtained in each set of samples are shown in the below table.
| Samples | Number of females | Samples | Number of females |
| Sample 1 | 2 | Sample 11 | 1 |
| Sample 2 | 1 | Sample 12 | 2 |
| Sample 3 | 2 | Sample 13 | 4 |
| Sample 4 | 3 | Sample 14 | 2 |
| Sample 5 | 1 | Sample 15 | 3 |
| Sample 6 | 2 | Sample 16 | 2 |
| Sample 7 | 3 | Sample 17 | 0 |
| Sample 8 | 1 | Sample 18 | 2 |
| Sample 9 | 1 | Sample 19 | 1 |
| Sample 10 | 2 | Sample 20 | 2 |
To graph: The histogram for the number of females in each set of sample.
Explanation of Solution
Graph: To obtain the histogram for the obtained result in previous part, Excel is used. The below steps are followed to obtain the required histogram.
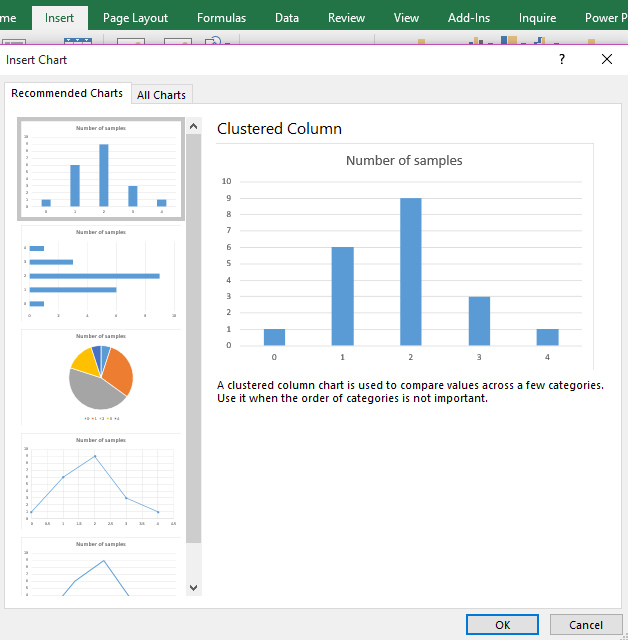
Step 1: The number of females varies from 0 to 4. The number of samples are calculated corresponding to each number of females. The number of samples with the same number of female members is clustered. The snapshot of the obtained table is shown below:
| Number of female members | Number of samples |
| 0 | 1 |
| 1 | 6 |
| 2 | 9 |
| 3 | 3 |
| 4 | 1 |
Step 2: Select the data set and go to insert and select the option of cluster column under the Recommended Charts. The screenshot is shown below:
Step 3: Click on OK. The diagram is obtained as:
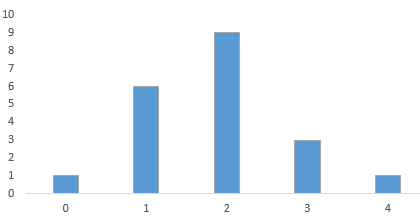
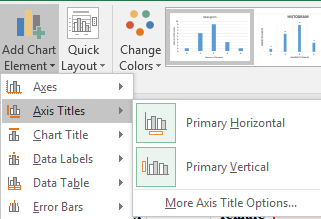
Step 4: Click on the chart area and select the option of “Primary Horizontal” and “Primary Vertical” axis under the “Add Chart Element” to add the axis title. The screenshot is shown below:
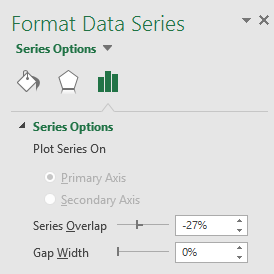
Step 5: Click on the bars of the diagrams and reduce the gap width to zero under the “Format Data Series” tab. The screenshot is shown below:
The obtained histogram is:
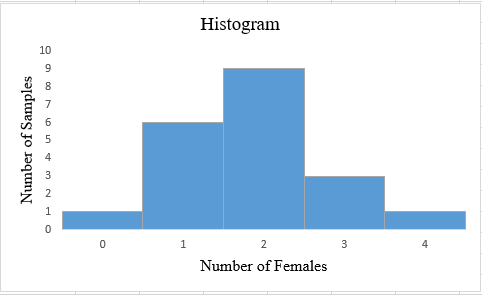
Interpretation: The obtained histogram for the number of females in each set of sample follows
To find: The average number of females in 20 samples.
Answer to Problem 13E
Solution: The average number of female is 1.85.
Explanation of Solution
Calculation:
The average number of females can be obtained by using the formula:
Hence, the average number of females is calculated as:
Therefore, the average number of females in 20 samples is 1.85.
(b)
To explain: Whether the club members should be doubtful about the discrimination if any of the five tickets does not received by women.
(b)
Answer to Problem 13E
Solution: The club member should suspect the discrimination if any of the five tickets does not received by women.
Explanation of Solution
Want to see more full solutions like this?
Chapter 3 Solutions
Statistics: Concepts and Controversies


 MATLAB: An Introduction with ApplicationsStatisticsISBN:9781119256830Author:Amos GilatPublisher:John Wiley & Sons Inc
 Probability and Statistics for Engineering and th...StatisticsISBN:9781305251809Author:Jay L. DevorePublisher:Cengage Learning
 Statistics for The Behavioral Sciences (MindTap C...StatisticsISBN:9781305504912Author:Frederick J Gravetter, Larry B. WallnauPublisher:Cengage Learning
 Elementary Statistics: Picturing the World (7th E...StatisticsISBN:9780134683416Author:Ron Larson, Betsy FarberPublisher:PEARSON
 The Basic Practice of StatisticsStatisticsISBN:9781319042578Author:David S. Moore, William I. Notz, Michael A. FlignerPublisher:W. H. Freeman
 Introduction to the Practice of StatisticsStatisticsISBN:9781319013387Author:David S. Moore, George P. McCabe, Bruce A. CraigPublisher:W. H. Freeman