
Concept explainers
Videos
Queen City
Cincinnati, Ohio, also known as the Queen City, has a population of approximately 298.000 and is the third largest city in the state of Ohio. The Cincinnati metropolitan area has a population of about 2.2 million. The city is governed by a mayor and a nine-member city council. The city manager, who is responsible for the day-to-day operation of the city, reports to the mayor and city council. The city manager recently created the Office of Performance and Data Analytics with the goal of improving the efficiency of city operations.
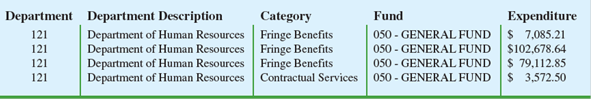
TABLE 2.21 ANNUAL EXPENDITURES FOR QUEEN CITY (FIRST FOUR ENTRIES)
One of the first tasks of this new office is to review the previous year’s expenditures. The file QueenCity contains data on the previous year’s expenditures, including the following:
Department The number of the department incurring the expenditure
Department Description The name of the department incurring the description
Category The category of the expenditure
Fund The fund to which the expenditure was charged
Expenditure The dollar amount of the expense
Table 2.21 shows the first four entries of the 5427 expenditures for the year. The city manager would like to use this data to better understand how the city’s budget is being spent.
Managerial Report
Use tabular and graphical methods of
- 1. Tables and/or graphical displays that show the amount of expenditures by category and percentage of total expenditures by category.
- 2. A table that shows the amount of expenditures by department and the percentage of total expenditures by department. Combine any department with less than 1% into a category named “Other.”
- 3. A table that shows the amount of expenditures by fund and the percentage of total expenditures by fund. Combine any fund with less than 1 % into a category named “Other.”
1.
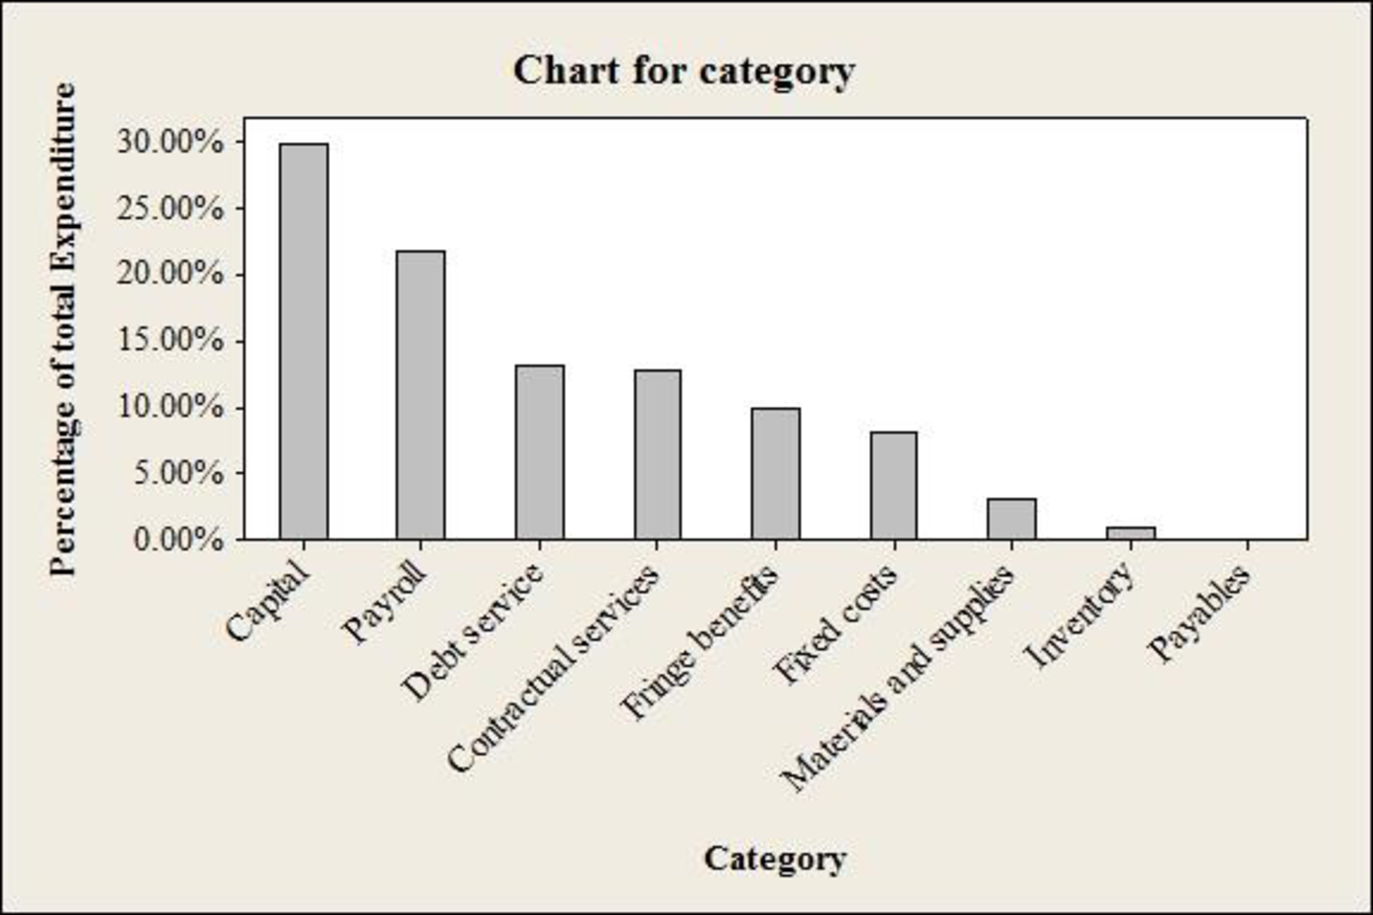
Make tabular and graphical displays that show the amount of expenditure by category and percentage of total expenditures by category.
Answer to Problem 3CP
The table represents the total amount of expenditure by category and percentage of total expenditures by category.
| Category | Total Expenditure | Percentage of total Expenditure |
| Capital | $198,365,854 | 29.98% |
| Payroll | $145,017,555 | 21.92% |
| Debt service | $86,913,978 | 13.14% |
| Contractual services | $85,043,249 | 12.85% |
| Fringe benefits | $66,053,340 | 9.98% |
| Fixed costs | $53,732,177 | 8.12% |
| Materials and supplies | $19,934,710 | 3.01% |
| Inventory | $6,393,394 | 0.97% |
| Payables | $180,435 | 0.03% |
| Grand Total | $661,634,693 | 100.0% |
The bar chart for “Category” is given below:
Explanation of Solution
Calculation:
The table represents the sample of 5,427 entries annual expenditures for queen city (Cincinnati, Ohio) for the year. The five types of variables present in the data are department serial number, department description, category name, fund and expenditure.
From the data set, the variable “Category” consists of nine entities namely capital, payroll, debt service, contractual services, fringe benefits, fixed costs, Materials and supplies, inventory and payable.
Therefore, the following table shows the amount of all nine entities total expenditure by category.
| Category | Total Expenditure |
| Capital | $198,365,854 |
| Payroll | $145,017,555 |
| Debt service | $86,913,978 |
| Contractual services | $85,043,249 |
| Fringe benefits | $66,053,340 |
| Fixed costs | $53,732,177 |
| Materials and supplies | $19,934,710 |
| Inventory | $6,393,394 |
| Payables | $180,435 |
| Grand Total | $661,634,693 |
The percentage for capital is calculated as the ratio of total expenditure for capital to the grand totals of all categories.
The following table shows the percentage of amount of all nine entities total expenditure by category:
| Category | Total Expenditure | Percentage of total Expenditure |
| Capital | $198,365,854 | 29.98% |
| Payroll | $145,017,555 | 21.92% |
| Debt service | $86,913,978 | 13.14% |
| Contractual services | $85,043,249 | 12.85% |
| Fringe benefits | $66,053,340 | 9.98% |
| Fixed costs | $53,732,177 | 8.12% |
| Materials and supplies | $19,934,710 | 3.01% |
| Inventory | $6,393,394 | 0.97% |
| Payables | $180,435 | 0.03% |
| Grand Total | $661,634,693 | 100.0% |
Software procedure:
Step-by-step software procedure to obtain bar chart for category using MINITAB software is as follows:
- From Bars represent, choose Values from a table.
- UnderOne column of values, choose Simple. Click OK.
- Choose Simple, and then click OK.
- In Graph variables, enter the column of percent frequency for total expenditure.
- In Categorical variables, enter the column of entities of category.
- Click OK.
Output using the MINITAB software is given below:
From the obtained table and bar chart, it is observed that the Capital expenditures and payroll account for over 50% of all expenditures.
Also, the total expenditures are over $660 million. Debt Service seems to be high, and it is found to be over 10% of total expenditures.
2.
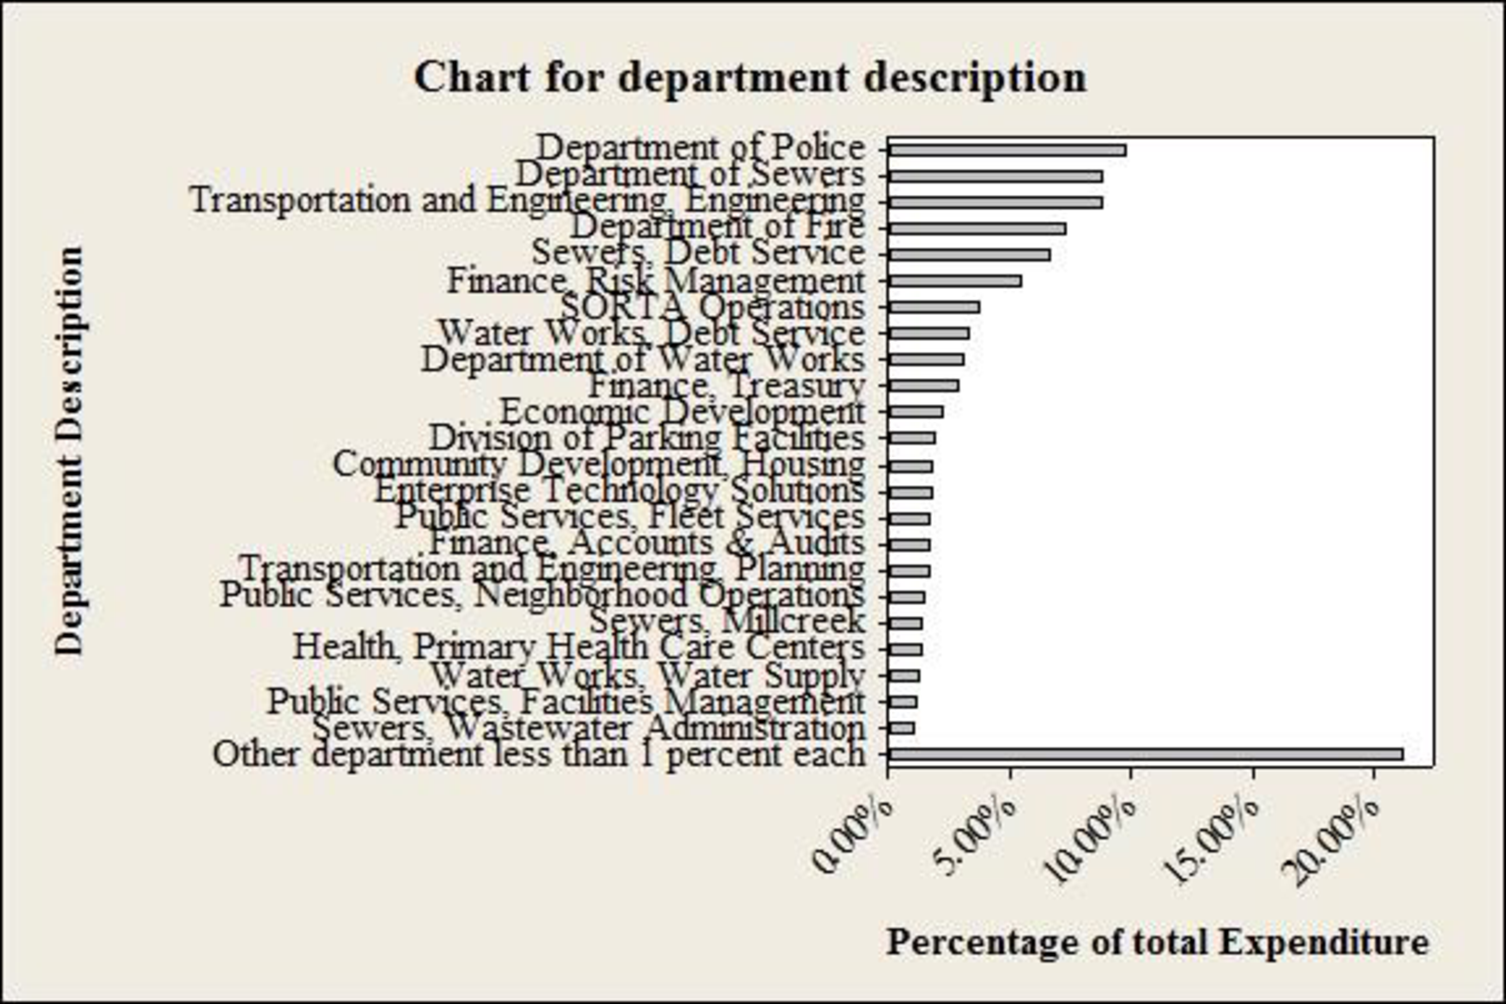
Make tabular displays that show the amount of expenditure by department and percentage of total expenditures by department.
Answer to Problem 3CP
The table represents the total amount of expenditure by department and percentage of total expenditures by department.
| Department Description | Percentage of total Expenditure | Total Expenditure |
| Department of Police | 9.72% | 64,295,941 |
| Department of Sewers | 8.76% | 57,954,955 |
| Transportation and Engineering, Engineering | 8.72% | 57,686,199 |
| Department of Fire | 7.23% | 47,838,396 |
| Sewers, Debt Service | 6.59% | 43,585,814 |
| Finance, Risk Management | 5.39% | 35,654,238 |
| SORTA Operations | 3.62% | 23,975,000 |
| Water Works, Debt Service | 3.24% | 21,418,102 |
| Department of Water Works | 3.07% | 20,307,505 |
| Finance, Treasury | 2.80% | 18,531,650 |
| Economic Development | 2.13% | 14,078,735 |
| Division of Parking Facilities | 1.89% | 12,489,731 |
| Community Development, Housing | 1.75% | 11,556,943 |
| Enterprise Technology Solutions | 1.71% | 11,314,215 |
| Public Services, Fleet Services | 1.66% | 10,982,312 |
| Finance, Accounts & Audits | 1.66% | 10,960,345 |
| Transportation and Engineering, Planning | 1.63% | 10,764,138 |
| Public Services, Neighborhood Operations | 1.38% | 9,140,769 |
| Sewers, Millcreek | 1.30% | 8,575,226 |
| Health, Primary Health Care Centers | 1.25% | 8,268,632 |
| Water Works, Water Supply | 1.19% | 7,883,099 |
| Public Services, Facilities Management | 1.13% | 7,469,863 |
| Sewers, Wastewater Administration | 1.01% | 6,668,240 |
| Other department less than 1 percent each | 21.2% | 1,40,234,644 |
The bar chart for “Department description” is given below:
Explanation of Solution
Calculation:
Here, any departments with less than 1% are combined into a category named “other”.
Department descriptionwith less than 1% is tabulated as follows with named as “other”:
| Other (department description less than 1%) | Percentage of total Expenditure | Total Expenditure |
| Water Works, Distribution | 0.98% | 64,90,554 |
| Public Services, Traffic and Road Operations | 0.89% | 58,84,799 |
| Parks, Administrative and Program Services | 0.87% | 57,44,316 |
| Water Works, Commercial Services | 0.81% | 53,60,380 |
| Sewers, Wastewater Collection | 0.81% | 53,31,756 |
| Sewers, Director/Stormwater | 0.79% | 52,13,170 |
| Parks, Operations and Facility Mgmt | 0.76% | 50,08,200 |
| Police Emergency Communications | 0.69% | 45,57,589 |
| Division of Convention Center | 0.67% | 44,60,267 |
| Health, Primary Health Care Programs | 0.58% | 38,21,334 |
| Health, Community Health Services | 0.56% | 36,75,649 |
| Sewers, Maintenance | 0.55% | 36,68,040 |
| Water Works, Water Quality and Treatment | 0.51% | 33,95,988 |
| Recreation, Support Services | 0.50% | 33,15,938 |
| Law Department | 0.47% | 30,78,594 |
| Recreation, Golf | 0.42% | 27,81,652 |
| Water Works, Business Services | 0.41% | 26,93,873 |
| New Construction & Building Standards | 0.40% | 26,77,798 |
| Water Works, Engineering | 0.39% | 25,83,805 |
| Division of Traffic Engineering | 0.38% | 25,04,453 |
| Cincinnati Public School Reserve | 0.38% | 25,00,000 |
| Sewers, Little Miami | 0.37% | 24,39,869 |
| Planning, Licenses & Permits | 0.36% | 23,71,973 |
| Workers' Compensation Insuranced | 0.33% | 22,14,094 |
| Motorized and Construction Equipment | 0.33% | 21,87,298 |
| Recreation, Maintenance | 0.33% | 21,62,545 |
| General Fund Overhead | 0.32% | 20,95,756 |
| Health, Primary School &Adolesent | 0.31% | 20,74,254 |
| Community Development Administration | 0.30% | 19,68,773 |
| Sewers, Industrial Waste | 0.28% | 18,41,374 |
| Office of the City Manager | 0.26% | 17,12,437 |
| Sewers, Project Delivery | 0.25% | 16,82,688 |
| Finance, Purchasing | 0.24% | 16,00,148 |
| Recreation, Athletics | 0.24% | 15,82,290 |
| Office of Environmental Qualities | 0.23% | 15,48,437 |
| Recreation, West Region | 0.22% | 14,87,931 |
| Finance, Income Tax | 0.22% | 14,83,479 |
| Health, Commissioner | 0.21% | 14,18,825 |
| Recreation, Central Region | 0.21% | 13,93,663 |
| Recreation, East Region | 0.20% | 13,50,682 |
| Community Development | 0.20% | 13,37,001 |
| Sewers, Muddy Creek | 0.18% | 12,11,584 |
| Health, Technical Resources | 0.17% | 11,22,229 |
| Sewers, Planning | 0.17% | 10,92,095 |
| Enterprise Software and Licenses | 0.16% | 10,82,024 |
| Water Works, IT | 0.16% | 10,39,488 |
| Sewers, Wastewater Engineering | 0.15% | 9,73,882 |
| Department of Human Resources | 0.14% | 9,29,460 |
| Department Of Planning & Buildings | 0.14% | 9,11,988 |
| Office and Technical Equipment | 0.13% | 8,63,762 |
| Bond Fund - Principal and Interest | 0.12% | 7,74,523 |
| Sewers, Sycamore | 0.11% | 7,54,132 |
| Transportation and Engineering Director | 0.11% | 7,20,092 |
| Division of Aviation | 0.11% | 7,02,480 |
| Budget & Evaluation | 0.08% | 5,62,270 |
| Sewers, Polk Run | 0.08% | 5,32,890 |
| Sewers, Taylor Creek | 0.08% | 5,29,774 |
| Citizens' Complaint Authority | 0.07% | 4,31,449 |
| Sewers, Superintendent | 0.06% | 4,28,268 |
| Contribution to Fire Pension | 0.06% | 4,16,783 |
| Contribution to Police Pension | 0.06% | 4,00,439 |
| Public Services, Director | 0.06% | 3,97,815 |
| Port Authority Greater Cincinnati Development | 0.05% | 3,50,000 |
| City Council | 0.05% | 3,37,658 |
| Hamilton Co. Auditor & Treasurer Fees | 0.05% | 2,98,758 |
| Office of The Clerk of Council | 0.04% | 2,93,185 |
| Office of The Mayor | 0.04% | 2,87,622 |
| Lump Sum Payments | 0.04% | 2,52,054 |
| Finance Director’s Office | 0.03% | 2,13,548 |
| County Clerk Fees | 0.03% | 1,75,000 |
| Public Employees Assistance Program | 0.02% | 1,61,711 |
| Police and Fire Fighter's Insurance | 0.02% | 1,15,000 |
| Parks, Office of Director | 0.01% | 94,987 |
| Special Investigations/Studies | 0.01% | 92,210 |
| Councilmember PG Sittenfeld | 0.01% | 77,451 |
| Surplus | 0.01% | 76,091 |
| Councilmember Y. Simpson | 0.01% | 70,985 |
| Councilmember W. Young | 0.01% | 63,012 |
| Councilmember R. Qualls | 0.01% | 62,862 |
| Councilmember C. Seelbach | 0.01% | 60,177 |
| Councilmember Quinlivan | 0.01% | 57,685 |
| Councilmember C. Winburn | 0.01% | 57,654 |
| Downtown Special Inprovement District | 0.01% | 56,000 |
| Memberships & Publications | 0.01% | 53,150 |
| Cincinnati Music Hall | 0.01% | 50,000 |
| Election Expense | 0.01% | 46,580 |
| Convention Facility Authority | 0.01% | 45,700 |
| Councilmember C. Thomas | 0.01% | 45,603 |
| Councilmember C. Smitherman | 0.01% | 43,141 |
| Mayor's Office Obligations | 0.01% | 41,194 |
| State Unemployment Comp | 0.00% | 31,671 |
| Manager's Office Obligations | 0.00% | 13,956 |
| Councilmember P. Thomas | 0.00% | 13,168 |
| Judgments Against the City | 0.00% | 7,644 |
| Department of Public Recreation | 0.00% | 5,093 |
| Audit & Examiners Fees | 0.00% | 5,000 |
From the data set, the variable “department description” has 119 different departments out of which 96 departments whose percentage is less than 1.
Therefore, the following table shows the expenditure of all 119 different departments.
| Department Description | Total Expenditure |
| Department of Police | 64,295,941 |
| Department of Sewers | 57,954,955 |
| Transportation and Engineering, Engineering | 57,686,199 |
| Department of Fire | 47,838,396 |
| Sewers, Debt Service | 43,585,814 |
| Finance, Risk Management | 35,654,238 |
| SORTA Operations | 23,975,000 |
| Water Works, Debt Service | 21,418,102 |
| Department of Water Works | 20,307,505 |
| Finance, Treasury | 18,531,650 |
| Economic Development | 14,078,735 |
| Division of Parking Facilities | 12,489,731 |
| Community Development, Housing | 11,556,943 |
| Enterprise Technology Solutions | 11,314,215 |
| Public Services, Fleet Services | 10,982,312 |
| Finance, Accounts & Audits | 10,960,345 |
| Transportation and Engineering, Planning | 10,764,138 |
| Public Services, Neighborhood Operations | 9,140,769 |
| Sewers, Millcreek | 8,575,226 |
| Health, Primary Health Care Centers | 8,268,632 |
| Water Works, Water Supply | 7,883,099 |
| Public Services, Facilities Management | 7,469,863 |
| Sewers, Wastewater Administration | 6,668,240 |
| Other department less than 1 percent each | 140,234,644 |
| Grand Total | 661,634,692 |
The percentage for department description is calculated as the ratio of total expenditure to the grand totals all departments.
Therefore, the following table shows the percentage of amount of all department total expenditure by department.
| Department Description | Percentage of total Expenditure |
| Department of Police | 9.72% |
| Department of Sewers | 8.76% |
| Transportation and Engineering, Engineering | 8.72% |
| Department of Fire | 7.23% |
| Sewers, Debt Service | 6.59% |
| Finance, Risk Management | 5.39% |
| SORTA Operations | 3.62% |
| Water Works, Debt Service | 3.24% |
| Department of Water Works | 3.07% |
| Finance, Treasury | 2.80% |
| Economic Development | 2.13% |
| Division of Parking Facilities | 1.89% |
| Community Development, Housing | 1.75% |
| Enterprise Technology Solutions | 1.71% |
| Public Services, Fleet Services | 1.66% |
| Finance, Accounts & Audits | 1.66% |
| Transportation and Engineering, Planning | 1.63% |
| Public Services, Neighborhood Operations | 1.38% |
| Sewers, Millcreek | 1.30% |
| Health, Primary Health Care Centers | 1.25% |
| Water Works, Water Supply | 1.19% |
| Public Services, Facilities Management | 1.13% |
| Sewers, Wastewater Administration | 1.01% |
| Other department less than 1 percent each | 21.2% |
Software procedure:
Step-by-step software procedure to obtain bar chart for category using MINITAB software is as follows:
- From Bars represent, choose Values from a table.
- Under One column of values, choose Simple. Click OK.
- Choose Simple, and then click OK.
- In Graph variables, enter the column of percent frequency for total expenditure in department.
- In Categorical variables, enter the column of entities of department
- Click OK.
Output using the MINITAB software is given below:

Interpretation:
- From the obtained table and bar chart, it is observed that, 96 departments showing total expenditure as less than 1% over 119 departments.
- There are six individual departments namely police, sewers, transportation Engineering, Fire, sewer debt service and financial/Risk management has total expenditure approximately 5 percent and more.
- Further, other department less than 1 percent each seems to be high, in terms of total expenditure percentage.
c.
Make tabular displays that show the amount of expenditure by fund and percentage of total expenditures by fund and Combine any department with less than 1% into a category named “other”.
Answer to Problem 3CP
The table represents the total amount of expenditure by Fund and percentage of total expenditures by Fund.
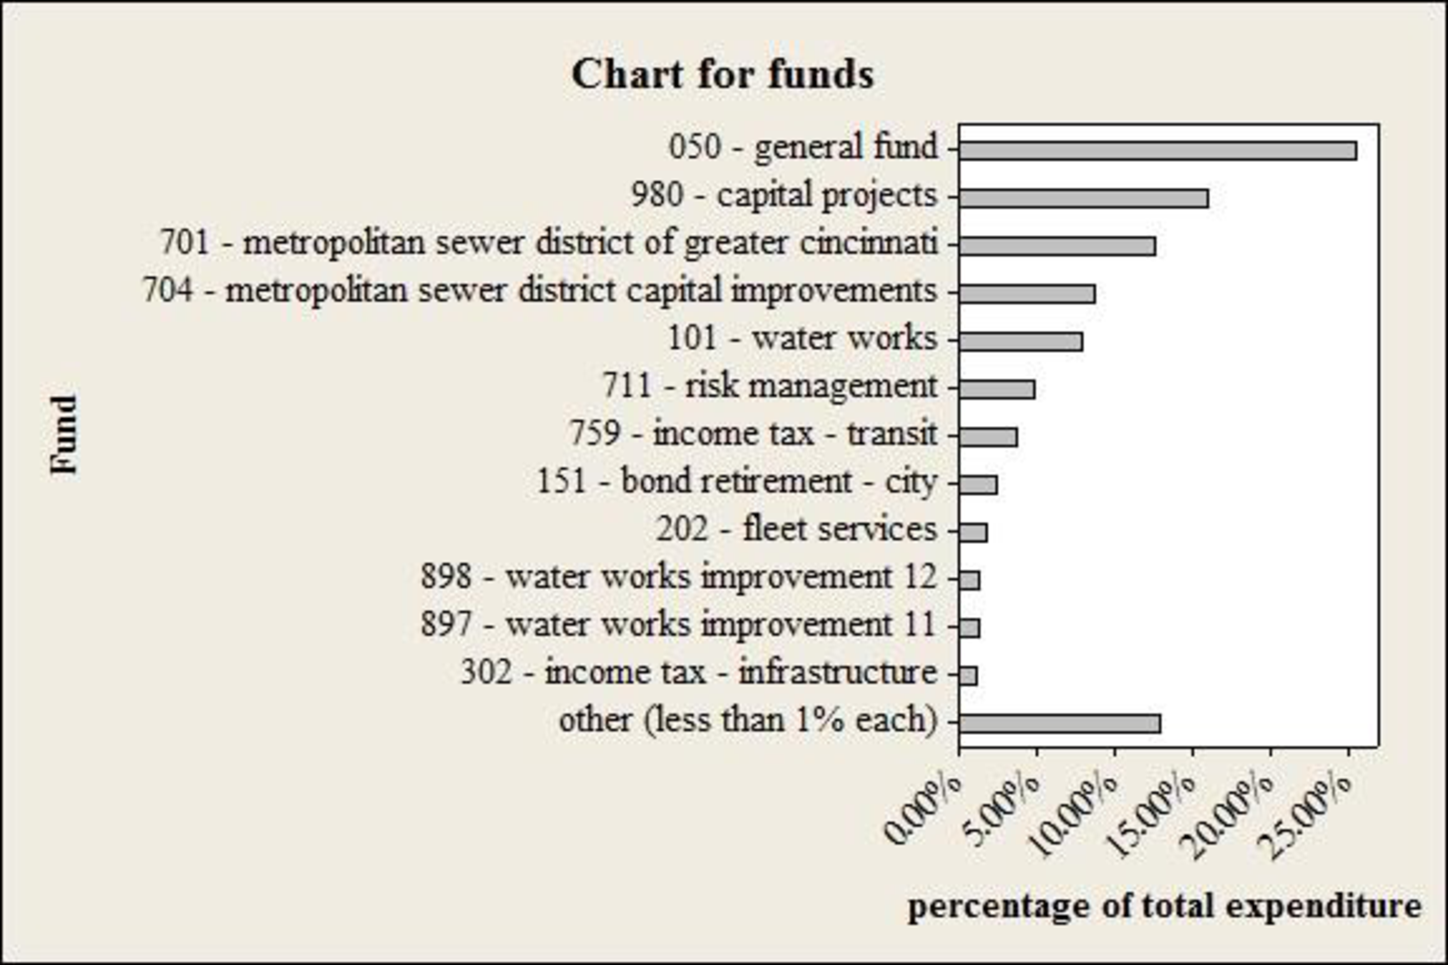
| Fund | Total expenditure | percentage of total expenditure |
| 050 - general fund | 16,86,07,659 | 25.5% |
| 980 - capital projects | 10,61,80,470 | 16.0% |
| 701 - metropolitan sewer district of greater cincinnati | 8,37,13,741 | 12.7% |
| 704 - metropolitan sewer district capital improvements | 5,79,54,955 | 8.8% |
| 101 - water works | 5,22,92,202 | 7.9% |
| 711 - risk management | 3,23,80,425 | 4.9% |
| 759 - income tax - transit | 2,42,39,259 | 3.7% |
| 151 - bond retirement - city | 1,55,84,916 | 2.4% |
| 202 - fleet services | 1,09,94,649 | 1.7% |
| 898 - water works improvement 12 | 84,83,304 | 1.3% |
| 897 - water works improvement 11 | 84,34,379 | 1.3% |
| 302 - income tax - infrastructure | 71,02,773 | 1.1% |
| other (less than 1% each) | 8,56,65,960 | 12.9% |
| Grand Total | 66,16,34,693 | 100.0% |
The bar chart for “Fund” is given below:

Explanation of Solution
Calculation:
Fund with less than 1% is tabulated as follows with named as “other”:
| Other (Fund less than 1%) | Total Expenditure | Percentage of total expenditure |
| 155 – u square revenue bonds -trustee | 47,48,810 | 0.80% |
| 304 - community development block grant | 46,96,312 | 0.70% |
| 301 - street construction, maintenance and repair | 40,53,506 | 0.70% |
| 103 - duke energy convention center | 35,08,157 | 0.60% |
| 102 - parking system facilities | 33,88,305 | 0.50% |
| 702 - enterprise technology solutions | 32,16,237 | 0.50% |
| 762 - urban redevelopment tax increment equivalent | 28,16,029 | 0.50% |
| 105 - municipal golf activities | 25,96,303 | 0.40% |
| 395 - health services | 24,11,634 | 0.40% |
| 107 - stormwater management | 23,25,888 | 0.40% |
| 368 - law enforcement grant | 22,22,595 | 0.40% |
| 410 - shelter plus care program | 21,62,535 | 0.30% |
| 449 - cincinnati area geographic information system (cagis) | 21,59,283 | 0.30% |
| 353 - home health services | 20,99,548 | 0.30% |
| 457 - clear fund | 19,57,914 | 0.30% |
| 213 - worker''s compensation | 18,17,200 | 0.30% |
| 758 - income tax permanent improvement fund | 17,66,123 | 0.30% |
| 214 - water works stores - chemicals | 15,26,281 | 0.30% |
| 204 - water works stores - materials | 15,06,447 | 0.20% |
| 391 - women and infants food grant program | 14,26,434 | 0.20% |
| 472 - fire grants | 13,62,498 | 0.20% |
| 307 - convention center expansion tax | 12,96,800 | 0.20% |
| 212 - employee safety and risk management | 12,16,265 | 0.20% |
| 491 - municipal public improvement equivalent fund | 12,12,813 | 0.20% |
| 438 - neiborhood stabilization program | 12,11,603 | 0.20% |
| 795 - downtown special inprovement district | 12,02,786 | 0.20% |
| 201 - printing services/ stores | 11,41,805 | 0.20% |
| 306 - municipal motor vehicle license tax | 10,77,283 | 0.20% |
| 323 - recreation special activities | 10,69,119 | 0.20% |
| 411 - home investment trust | 9,91,223 | 0.20% |
| 349 - urban renewal debt retirement | 9,79,853 | 0.10% |
| 350 - public health research | 8,51,919 | 0.10% |
| 418 - federal health program income | 8,48,578 | 0.10% |
| 792 - forestry | 7,40,592 | 0.10% |
| 340 - centennial operations | 7,24,704 | 0.10% |
| 757 - miscellaneous permanent improvement fund | 6,62,729 | 0.10% |
| 104 - lunken airport | 5,86,663 | 0.10% |
| 487 - cuf/heights equivalent fund | 5,62,261 | 0.10% |
| 483 - downtown/otr east equivalent fund | 5,58,694 | 0.10% |
| 156 - fountain square west revenue bonds - trustee | 5,57,577 | 0.10% |
| 412 - food service license fees | 5,50,645 | 0.10% |
| 369 - criminal activity forfeiture - state | 5,23,925 | 0.10% |
| 488 –corryville equivalent fund | 5,19,767 | 0.10% |
| 502 - arra federal grants | 5,09,814 | 0.10% |
| 445 - emergency shelter | 4,53,541 | 0.10% |
| 465 - housing opportunities for persons with aids | 3,73,929 | 0.10% |
| 498 –maidisonvill equivalent fund | 3,63,449 | 0.10% |
| 332 - krohn conservatory | 3,02,862 | 0.10% |
| 364 - 911 cell phone fees | 2,99,652 | 0.00% |
| 381 - cincinnati abatement project | 2,84,022 | 0.00% |
| 317 - urban development - property operations | 2,28,247 | 0.00% |
| 461 - fema grant | 2,19,424 | 0.00% |
| 793 - boulevard light energy and maintenance (blem) | 1,83,378 | 0.00% |
| 324 - recreation federal grant projects | 1,78,387 | 0.00% |
| 166 - graeters revenue bonds - trustee | 1,76,113 | 0.00% |
| 326 - park donations and special activity | 1,71,770 | 0.00% |
| 210 - highway maintenance stores | 1,69,814 | 0.00% |
| 342 - new city buildings operations | 1,67,023 | 0.00% |
| 420 - public employee assistance program | 1,65,141 | 0.00% |
| 446 - health network | 1,64,337 | 0.00% |
| 209 - property management | 1,62,435 | 0.00% |
| 618 - towing charges - private operators | 1,50,000 | 0.00% |
| 314 - special events | 1,46,679 | 0.00% |
| 481 - downtown south/riverfront equivalent fund | 1,44,066 | 0.00% |
| 367 - criminal activity forfeiture - federal | 1,31,116 | 0.00% |
| 753 - expressways/gateways | 1,26,717 | 0.00% |
| 486 - east walnut hills equivalent fund | 1,25,855 | 0.00% |
| 499 - oakley equivalent fund | 1,23,924 | 0.00% |
| 436 - environmental studies | 1,22,482 | 0.00% |
| 318 - sawyer point | 1,15,771 | 0.00% |
| 330 - park lodge/pavilion deposits | 1,02,413 | 0.00% |
| 482 - downtown/otr west equivalent fund | 97,418 | 0.00% |
| 756 - water works capital | 78,225 | 0.00% |
| 485 - walnut hills equivalent fund | 77,402 | 0.00% |
| 207 - recreation stores | 76,091 | 0.00% |
| 161 - msd debt service - trustee - multi series | 71,262 | 0.00% |
| 752 - park board | 69,499 | 0.00% |
| 415 - immunization action plan | 63,781 | 0.00% |
| 478 - justice assistance grant | 56,049 | 0.00% |
| 425 - heart health in hamilton county project | 48,994 | 0.00% |
| 387 - lead hazard control research grant | 48,025 | 0.00% |
| 791 - sidewalks | 45,700 | 0.00% |
| 715 - convention facility authority | 44,830 | 0.00% |
| 454 –metrolpolitain medical response | 42,877 | 0.00% |
| 428 - urban forestry | 41,771 | 0.00% |
| 448 - health care services for the homeless | 41,475 | 0.00% |
| 370 - drug offender fines | 39,325 | 0.00% |
| 363 - solid waste disposal control | 38,714 | 0.00% |
| 490 - evanston equivalent fund | 37,825 | 0.00% |
| 354 - household sewage treatment fees | 35,989 | 0.00% |
| 380 - lead poisoning control | 35,194 | 0.00% |
| 394 - state health program income | 29,632 | 0.00% |
| 413 - swimming pool license fees | 26,801 | 0.00% |
| 476 - uasi grant | 25,094 | 0.00% |
| 405 - market facilities | 24,099 | 0.00% |
| 389 - communications and marketing activities | 22,805 | 0.00% |
| other (less than 1% each) | 85,665,960 | 12.9% |
From the above table, the other category has the total expenditure $85,665,960.
Therefore, the following table shows the amount of all 13 entities total expenditure by Fund.
| Fund | Total expenditure |
| 050 - general fund | 16,86,07,659 |
| 980 - capital projects | 10,61,80,470 |
| 701 - metropolitan sewer district of greater cincinnati | 8,37,13,741 |
| 704 - metropolitan sewer district capital improvements | 5,79,54,955 |
| 101 - water works | 5,22,92,202 |
| 711 - risk management | 3,23,80,425 |
| 759 - income tax - transit | 2,42,39,259 |
| 151 - bond retirement - city | 1,55,84,916 |
| 202 - fleet services | 1,09,94,649 |
| 898 - water works improvement 12 | 84,83,304 |
| 897 - water works improvement 11 | 84,34,379 |
| 302 - income tax - infrastructure | 71,02,773 |
| other (less than 1% each) | 8,56,65,960 |
| Total | 66,16,34,693 |
The percentage for fund is calculated as the ratio of total expenditure to the grand totals all funds.
Therefore, the following table shows the percentage of amount of all fund total expenditure by funds
| Fund | Percentage of total expenditure |
| 050 - general fund | 25.5% |
| 980 - capital projects | 16.0% |
| 701 - metropolitan sewer district of greater cincinnati | 12.7% |
| 704 - metropolitan sewer district capital improvements | 8.8% |
| 101 - water works | 7.9% |
| 711 - risk management | 4.9% |
| 759 - income tax - transit | 3.7% |
| 151 - bond retirement - city | 2.4% |
| 202 - fleet services | 1.7% |
| 898 - water works improvement 12 | 1.3% |
| 897 - water works improvement 11 | 1.3% |
| 302 - income tax - infrastructure | 1.1% |
| other (less than 1% each) | 12.9% |
| Total | 100.0% |
Software procedure:
Step-by-step software procedure to obtain bar chart for category using MINITAB software is as follows:
- From Bars represent, choose Values from a table.
- Under One column of values, choose Simple. Click OK.
- Choose Simple, and then click OK.
- In Graph variables, enter the column of percent frequency for total expenditure in funds.
- In Categorical variables, enter the column of entities of funds.
- Click OK.
Output using the MINITAB software is given below:
Interpretationn:
- From the obtained table and bar chart, it is observed that, the fund category 050-General fund seems to be high, in terms of total expenditure percentage.
Want to see more full solutions like this?
Chapter 2 Solutions
STATISTICS F/BUSINESS+ECONOMICS-TEXT


- Cholesterol Cholesterol in human blood is necessary, but too much can lead to health problems. There are three main types of cholesterol: HDL (high-density lipoproteins), LDL (low-density lipoproteins), and VLDL (very low-density lipoproteins). HDL is considered “good” cholesterol; LDL and VLDL are considered “bad” cholesterol. A standard fasting cholesterol blood test measures total cholesterol, HDL cholesterol, and triglycerides. These numbers are used to estimate LDL and VLDL, which are difficult to measure directly. Your doctor recommends that your combined LDL/VLDL cholesterol level be less than 130 milligrams per deciliter, your HDL cholesterol level be at least 60 milligrams per deciliter, and your total cholesterol level be no more than 200 milligrams per deciliter. (a) Write a system of linear inequalities for the recommended cholesterol levels. Let x represent the HDL cholesterol level, and let y represent the combined LDL VLDL cholesterol level. (b) Graph the system of inequalities from part (a). Label any vertices of the solution region. (c) Is the following set of cholesterol levels within the recommendations? Explain. LDL/VLDL: 120 milligrams per deciliter HDL: 90 milligrams per deciliter Total: 210 milligrams per deciliter (d) Give an example of cholesterol levels in which the LDL/VLDL cholesterol level is too high but the HDL cholesterol level is acceptable. (e) Another recommendation is that the ratio of total cholesterol to HDL cholesterol be less than 4 (that is, less than 4 to 1). Identify a point in the solution region from part (b) that meets this recommendation, and explain why it meets the recommendation.arrow_forwardName the four parts of a mathematical system. HINT: See Section 1.3arrow_forwardAn organization estimated that in a particular year the population of a country spent $10.5 trillion in personal consumption. The major categories of these expenditures are durable goods($1.1trillion; for example, cars, furniture, recreational equipment), nondurable goods($2.1trillion; for example, food, clothing, fuel), and services($7.1trillion; for example, health care, education, transportation). Complete parts (a) through (e) below. a. What is the approximate annual per capita spending for personal consumption? Assume a population of 265million. (Round to the nearest dollar as needed.) b. What is the approximate daily per capita spending for personal consumption? (Round to the nearest dollar as needed.) c. On average about what percentage of personal spending is devoted to services? (Round to the nearest percent as needed.) d. Spending on health care was estimated to be$1.1 trillion in that year. About what percentage of all personal…arrow_forward
- The average monthly residential gas bill for Black Hills Energy customers in Cheyenne, Wyoming is (Wyoming Public Service Commission website). How is the average monthly gas bill for a Cheyenne residence related to the square footage, number of rooms, and age of the residence? The following data show the average monthly gas bill for last year, square footage, number of rooms, and age for typical Cheyenne residences. Average Monthly Gas Number of Bill for Last Year Age Square Footage Rooms $70.20 16 2537 6 $81.33 2 3437 8 $45.86 27 976 6 $59.21 11 1713 7 $117.88 16 3979 11 $57.78 2 1328 7 $47.01 27 1251 6 $52.89 4 827 5 $32.90 12 645 4 $67.04 29 2849 5 $76.76 1 2392 7 $60.40 26 900 5 $44.07 14 1386 5 $26.68 20 1299 4 $62.70 17 1441 6 $45.37 13 562 4 $38.09 10 2140 4 $45.31 22 908 6 $52.45 24 1568 5 $96.11 27 1140 10…arrow_forwardPrices and mileage of 30 Subaru Forester models within 50 miles of Columbus, Indiana are collected from Cargarus.com. Mileage ranged from 7,442 to 77,674 miles. Prices ranged from $25,560 to $29,990. Attached file.arrow_forwardCharity Navigator is America's leading independent charity evaluator. The following data show the total expenses ($), the percentage of the total budget spent on administrative expenses, the percentage spent on fundraising, and the percentage spent on program expenses for 10 supersized charities (Charity Navigator website). Administrative expenses include overhead, administrative staff and associated costs, and organizational meetings. Fundraising expenses are what a charity spends to raise money, and program expenses are what the charity spends on the programs and services it exists to deliver. The sum of the three percentages does not add to 100% because of rounding. Do not round your intermediate calculations. Total Administrative Fundraising Program Expenses Expenses Expenses Expenses Charity (millions of $) (%) (%) (%) 1 American Red Cross 3350 3.7 3.8 92.0 2 World Vision 1210 3.8 7.8 88.3 3 Smithsonian Institution 1080 23.8 2.3 73.8 4 Food For The Poor 1052 0.7 2.1 96.7 5…arrow_forward
- Charity Navigator is America's leading independent charity evaluator. The following data show the total expenses ($), the percentage of the total budget spent on administrative expenses, the percentage spent on fundraising, and the percentage spent on program expenses for 10 supersized charities (Charity Navigator website). Administrative expenses include overhead, administrative staff and associated costs, and organizational meetings. Fundraising expenses are what a charity spends to raise money, and program expenses are what the charity spends on the programs and services it exists to deliver. The sum of the three percentages does not add to 100% because of rounding. Do not round your intermediate calculations. Total Administrative Fundraising Program Expenses Expenses Expenses Expenses Charity (millions of $) (%) (%) (%) 1 American Red Cross 3352 3.9 3.9 92.3 2 World Vision 1205 4.1 7.5 88.3 3 Smithsonian Institution 1082 23.4 2.6 73.9 4 Food For The Poor 1048 0.5 2.3 96.9 5…arrow_forwardCharity Navigator is America's leading independent charity evaluator. The following data show the total expenses ($), the percentage of the total budget spent on administrative expenses, the percentage spent on fundraising, and the percentage spent on program expenses for 10 supersized charities (Charity Navigator website). Administrative expenses include overhead, administrative staff and associated costs, and organizational meetings. Fundraising expenses are what a charity spends to raise money, and program expenses are what the charity spends on the programs and services it exists to deliver. The sum of the three percentages does not add to 100% because of rounding. Do not round your intermediate calculations. Charity Total Administrative Fundraising Program Expenses Expenses Expenses Expenses (millions of $) (%) Fundraising Program 1 American Red Cross 3352 3.9 3.9 92.2 2 World Vision 1210 3.8 7.8 88.6 3 Smithsonian Institution 1082 23.5 2.6 73.6 4 Food For…arrow_forwardIn 2012 in the United States, most electricity was generated from coal (37%), natural gas (30%), or nuclear power plants (19%). Hydropower accounted for 7% of the total electricity produced; other renewable sources such as wind or solar power accounted for 5%. Other nonrenewable sources (such as petroleum) made up the remaining 2%. Complete parts a through d below. a. Display the information in a bar graph. The bars, from left to right, represent coal, natural gas, nuclear power, hydropower, wind or solar, and other nonrenewable sources. Choose the correct graph below. O B. O A. Q 40- 40- 30- 30- Q 20- 20- 10- 10- G 0- Electricity Source Electricity Source Q 40 40- Q Q 30- 30- 20- 20- 10- 10- 0- 0- Electricity Source Electricity Source b. Which is easier to sketch relatively accurately, a pie chart or a bar chart? O A. A bar chart is easier because the bars are always in decreasing order of category percentages, which makes comparisons of categories easier. OB. A pie chart is easier…arrow_forward
- The Donaldson Furniture Company produces three types of rocking chairs: the children's model, the standard model, and the executive model. Each chair is made in three stages: cutting, construction, and finishing. Stage Cutting Construction Finishing Children's Standard 5 hr 4 hr 3 hr 2 hr 2 hr 2 hr ... The time needed for each stage of each chair is given in the chart. During a specific weel the company has available a maximum of 145 hours for cutting, 93 hours for construction and 74 hours for finishing. Determine how many of each type of chair the company shoul make to be operating at full capacity. Execut 7 hr 5 hr 4 hr The number of executive chairs the company should make is The number of standard chairs the company should make is The number of children's chairs the company should make isarrow_forwardA corporation that operates five suppliers of athletic apparel in a region provides merchandise for a shoe company. The shoe company recently sought information from the five plants. One variable for which data were collected was the total money (in dollars) the company spent on medical support for its employees in the first three months of the year. Data on number of employees at the plants are also shown below. Complete parts a and b. Medical Employees $7,788 121 $14,371 409 $12,776 256 $6,874 107 $3,907 O 68 a. Compute the weighted mean medical payments for these five plants using the numbers of employees as the weights. The weighted mean is $. (Round to the nearest dollar as needed.)arrow_forwardThe table shows the 2015 per capita total expenditure on health in 35 countries with the highest gross domestic product in that year. Health expenditure per capita is the sum of public and private health expenditures (in PPP, international $) divided by population. Health expenditures include the provision of health services, family-planning activities, nutrition activities, and emergency aid designated for health; health expenditures exclude the provision of water and sanitation. Per capita total expenditure on health (international dollars) Country Argentina Australia Austria Belgium D:1 Dollars 1390 4492 5138 4782 1200 Side-by-Side O Macmillan Learning Which country is the high outlier? O Switzerland Norway Germany O Indonesia O United Statesarrow_forward

 Elementary Geometry for College StudentsGeometryISBN:9781285195698Author:Daniel C. Alexander, Geralyn M. KoeberleinPublisher:Cengage Learning
 Algebra: Structure And Method, Book 1AlgebraISBN:9780395977224Author:Richard G. Brown, Mary P. Dolciani, Robert H. Sorgenfrey, William L. ColePublisher:McDougal Littell