
Videos
The weekly demand (in cases) for a particular brand of automatic dishwasher detergent for a chain of grocery stores located in Columbus, Ohio, follows.

- a. Construct a time series plot. What type of pattern exists in the data?
- b. Use a three-week moving average to develop a forecast for week 11.
- c. Use exponential smoothing with a smoothing constant of α = .2 to develop a forecast for week 11.
- d. Which of the two methods do you prefer? Why?
a.
Construct the time series plot.
Explain the type of pattern.
Answer to Problem 41SE
The time series plot is given below:
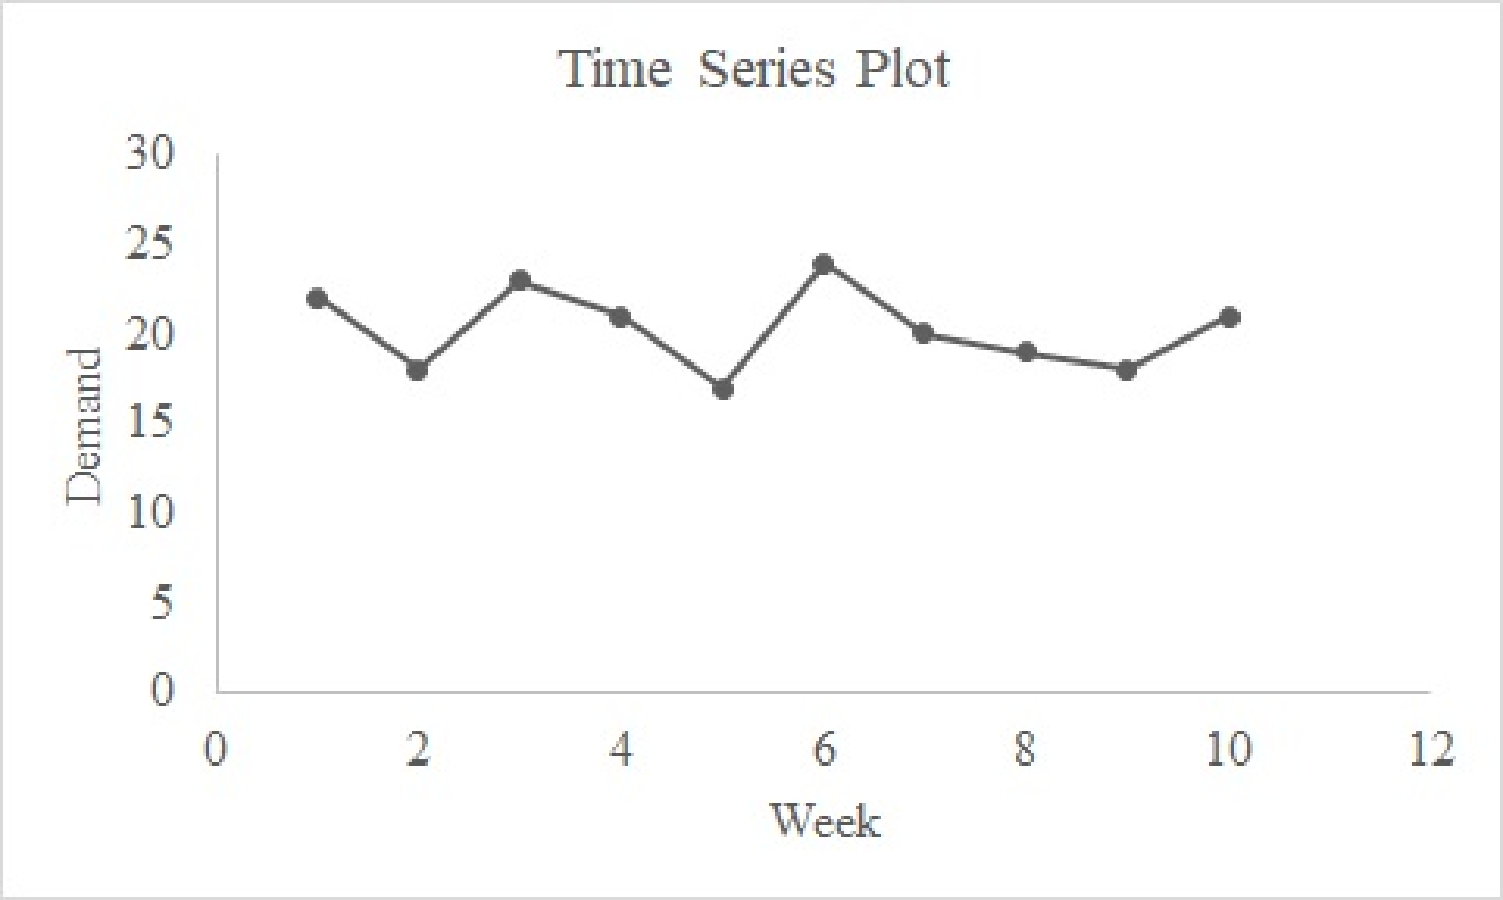
The pattern that appears in the graph is a horizontal pattern.
Explanation of Solution
Calculation:
The given data represent the weekly demand for automatic dishwasher detergent.
Software procedure:
Step-by-step software procedure to draw the time series plot using EXCEL:
- Open an EXCEL file.
- In column A, enter the data of Week, and in column B, enter the corresponding values of Demand.
- Select the data that are to be displayed.
- Click on the Insert Tab > select Scatter icon.
- Choose a Scatter with Straight Lines and Markers.
- Click on the chart > select Layout from the Chart Tools.
- Select Chart Title > Above Chart and enter Time Series Plot.
- Select Axis Title > Primary Horizontal Axis Title > Title Below Axis.
- Enter Week in the dialog box.
- Select Axis Title > Primary Vertical Axis Title > Rotated Title.
- Enter Demand in the dialog box.
From the output, the pattern that appears in the graph is a horizontal pattern.
b.
Calculate the forecast for week 11 using three-week moving averages.
Answer to Problem 41SE
The forecast for week 11 using three-week moving averages is 19.33.
Explanation of Solution
Calculation:
The forecast for week 11 using three-week moving averages is to be obtained.
Software procedure:
Step-by-step procedure to obtain the forecasts using EXCEL:
- In column A, enter the data of Month, and in column B, enter the corresponding values of Demand.
- In Data, select Data Analysis and choose Moving Average.
- In Input Range, select Demand.
- Select Label in First Row.
- In Interval, enter 3.
- In Output Range, select C3.
- Click OK.
Output using the EXCEL software is given below:
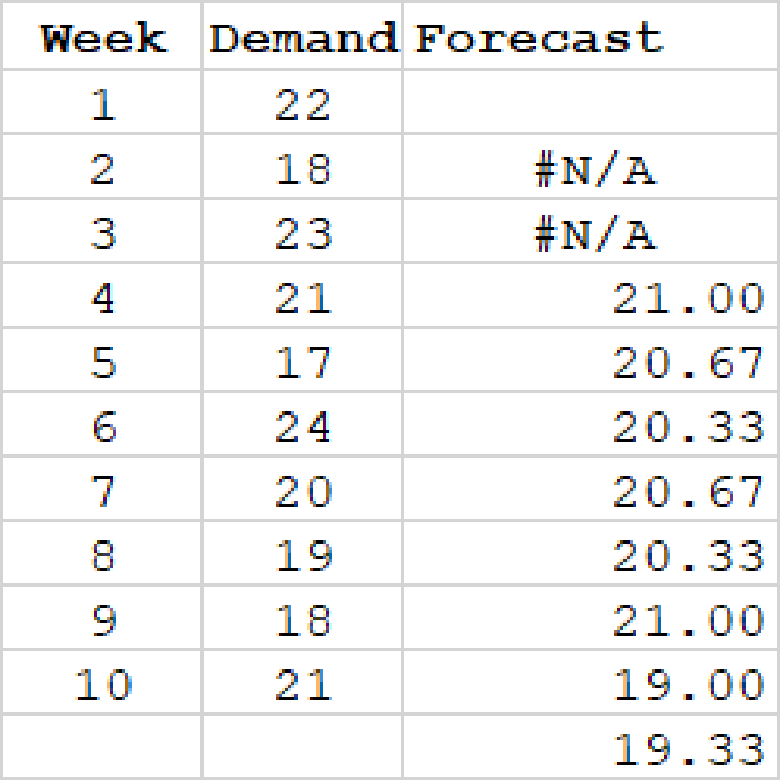
From the output, the forecast value for week 11 is 19.33.
c.
Calculate the forecast for week 11 using the exponential smoothing with constant 0.2.
Answer to Problem 41SE
The forecast for week 11 using the exponential smoothing with constant 0.2 is 20.14.
Explanation of Solution
Calculation:
It is given that
Software procedure:
Step-by-step procedure to obtain the forecasts using EXCEL:
- In column A, enter the data of Week, and in column B, enter the corresponding values of Demand.
- Select Data Analysis and choose Exponential Smoothing.
- In Input Range, select Demand.
- In Damping factor, enter 0.8.
- Select Label in First Row.
- In Output Range, select C2.
- Click OK.
Output using the EXCEL software is given below:
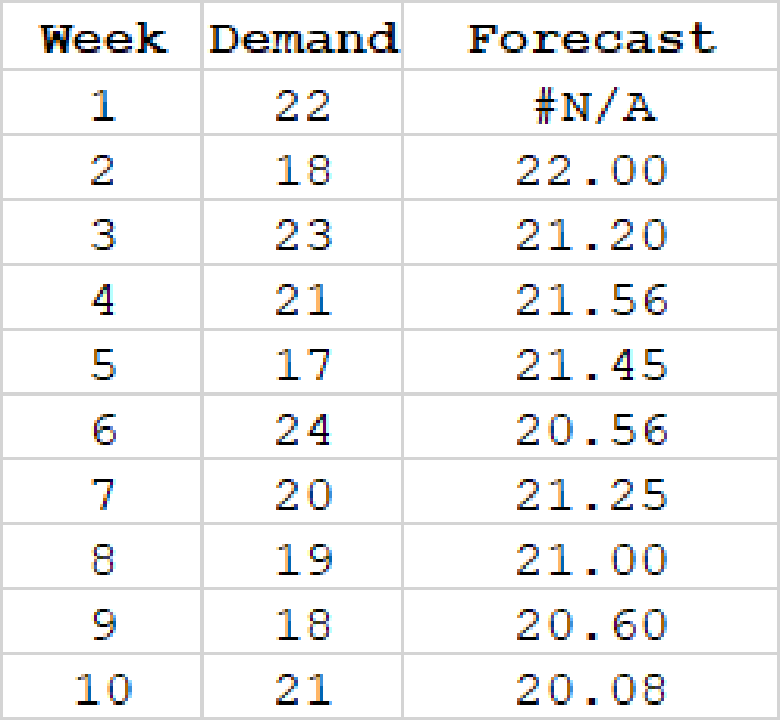
The forecast value for week 11 using exponential smoothing method is obtained as follows:
Here,
Thus, the forecast value for week 11 is 20.26.
d.
Identify the most preferable method between three-week moving averages and exponential smoothing. Explain the reason.
Answer to Problem 41SE
The three-week moving average gives the most accurate forecast because MSE for three-week moving averages is lesser when compared to the MSE for exponential smoothing.
Explanation of Solution
The formula for finding the forecast error2 is as follows:
For Week 3:
The forecast error2 for week 4 for 3-week moving average is obtained as follows:
The remaining forecasts errors2 for exponential smoothing averages are obtained as follows:
| Week | Demand | Forecast (Ft) for 3-Week Moving Average | (Forecast Error)2 | Forecast (Ft) for | (Forecast Error)2 |
| 1 | 7.35 | - | - | - | - |
| 2 | 7.4 | - | - | 22.00 | 16.00 |
| 3 | 7.55 | - | - | 21.20 | 3.24 |
| 4 | 7.56 | 21.00 | 0.00 | 21.56 | 0.31 |
| 5 | 7.6 | 20.67 | 13.44 | 21.45 | 19.78 |
| 6 | 7.52 | 20.33 | 13.44 | 20.56 | 11.84 |
| 7 | 7.52 | 20.67 | 0.44 | 21.25 | 1.55 |
| 8 | 7.7 | 20.33 | 1.78 | 21.00 | 3.99 |
| 9 | 7.62 | 21.00 | 9.00 | 20.60 | 6.75 |
| 10 | 7.55 | 19.00 | 4.00 | 20.08 | 0.85 |
| Total | 42.11 | 64.33 |
The MSE for 3-week moving average is obtained as follows:
Thus, the value of MSE for 3-week moving average is 6.02.
The MSE for exponential smoothing averages for
Thus, the value of MSE for exponential smoothing averages for
Here, it is observed that the MSE for three-week moving averages is lesser when compared to the MSE for exponential smoothing. Thus, the three-week moving average gives the most accurate forecast.
Want to see more full solutions like this?
Chapter 17 Solutions
Modern Business Statistics with Microsoft Office Excel (with XLSTAT Education Edition Printed Access Card) (MindTap Course List)


- Find the equation of the regression line for the following data set. x 1 2 3 y 0 3 4arrow_forwardTable 6 shows the year and the number ofpeople unemployed in a particular city for several years. Determine whether the trend appears linear. If so, and assuming the trend continues, in what year will the number of unemployed reach 5 people?arrow_forwardWhat does the y -intercept on the graph of a logistic equation correspond to for a population modeled by that equation?arrow_forward
 Calculus For The Life SciencesCalculusISBN:9780321964038Author:GREENWELL, Raymond N., RITCHEY, Nathan P., Lial, Margaret L.Publisher:Pearson Addison Wesley,
 Big Ideas Math A Bridge To Success Algebra 1: Stu...AlgebraISBN:9781680331141Author:HOUGHTON MIFFLIN HARCOURTPublisher:Houghton Mifflin Harcourt
 Glencoe Algebra 1, Student Edition, 9780079039897...AlgebraISBN:9780079039897Author:CarterPublisher:McGraw Hill
 Algebra and Trigonometry (MindTap Course List)AlgebraISBN:9781305071742Author:James Stewart, Lothar Redlin, Saleem WatsonPublisher:Cengage Learning
 Functions and Change: A Modeling Approach to Coll...AlgebraISBN:9781337111348Author:Bruce Crauder, Benny Evans, Alan NoellPublisher:Cengage Learning