
Concept explainers
Videos
a.
Test whether the linear relationship is useful or not at the 0.01 level of significance.
a.
Answer to Problem 63CR
There is convincing evidence that the linear relationship is useful between y and at least one of the predictors at the 0.01 level of significance.
Explanation of Solution
Calculation:
It is given that variable y is the average language score,
1.
The model is
2.
Null hypothesis:
That is, there is no useful linear relationship between y and any of the predictors.
3.
Alternative hypothesis:
That is, there is a useful linear relationship between y and any of the predictors.
4.
Here, the significance level is
5.
Test statistic:
Here, n is the sample size and k is the number of variables in the model.
6.
Assumptions:
Since there is no availability of original data to check the assumptions, there is a need to assume that the variables are related to the model, and the random deviation is distributed normally with mean 0 and the fixed standard deviation.
7.
Calculation:
The value of
The value of F-test statistic is calculated as follows:
8.
P-value:
Software procedure:
Step-by-step procedure to find the P-value using the MINITAB software:
- Choose Graph > Probability Distribution Plot choose View Probability > OK.
- From Distribution, choose ‘F’ distribution.
- Enter the Numerator df as 11 and Denominator df as 76.
- Click the Shaded Area tab.
- Choose X Value and Right Tail for the region of the curve to shade.
- Enter the X value as 12.24.
- Click OK.
Output obtained using the MINITAB software is represented as follows:
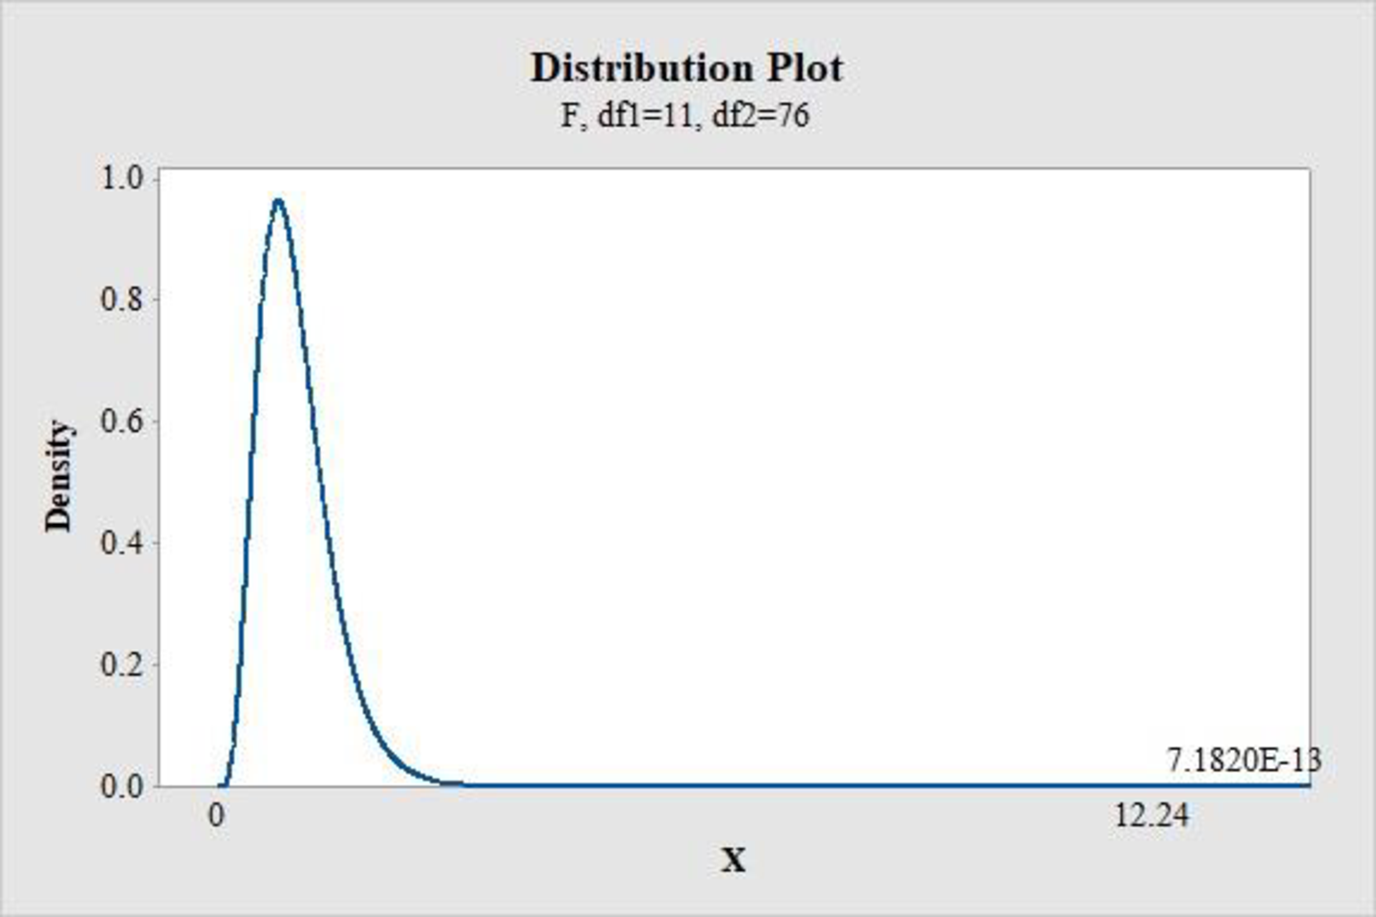
From MINITAB output, the P-value is 0.
9.
Conclusion:
If
Therefore, the P-value of 0 is less than the 0.01 level of significance.
Hence, reject the null hypothesis.
Thus, there is convincing evidence that the linear relationship is useful between y and at least one of the predictors at the 0.01 level of significance.
b.
Calculate the value of adjusted
b.
Answer to Problem 63CR
The value of adjusted
Explanation of Solution
Calculation:
The formula for adjusted
Substitute the value of
Thus, the value of adjusted
c.
Calculate a 95% confidence interval for
c.
Answer to Problem 63CR
The 95% confidence interval for
Explanation of Solution
Calculation:
Here,
Since there is no availability of original data to check the assumptions, there is a need to assume that the variables are related to the model, and the random deviation is distributed normally with mean 0 and the fixed standard deviation.
The formula for confidence interval for
Where,
Degrees of freedom:
Software procedure:
Step-by-step procedure to find P-value using the MINITAB software:
- Choose Graph > Probability Distribution Plot choose View Probability > OK.
- From Distribution, choose ‘t’ distribution.
- Enter the Degrees of freedom as 76.
- Click the Shaded Area tab.
- Choose Probability and Both Tails for the region of the curve to shade.
- Enter the Probability value as 0.05.
- Click OK.
Output obtained using the MINITAB software is represented as follows:
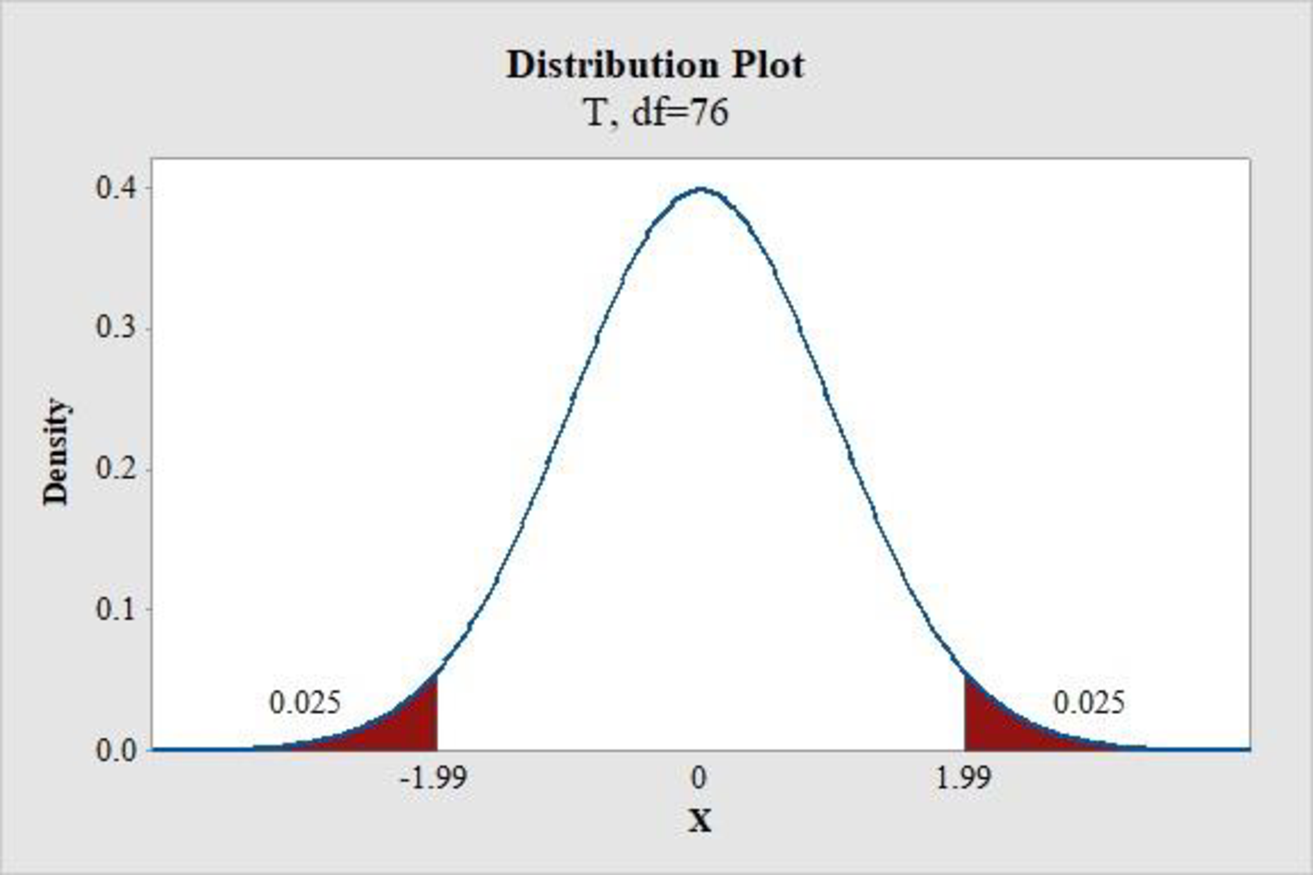
From the MINITAB output, the critical value is 1.99.
The value of
Here, the value of
The 95% confidence interval for
Thus, the 95% confidence interval for
Interpretation:
There is 95% confidence that the average increase in y associated with 1-unit increase in occupational index is between 0.1615 and 0.7545, when the other predictors are fixed.
d.
Check whether one or more predictors could be eliminated from the model and find which one could be eliminated first.
d.
Answer to Problem 63CR
The variable
Explanation of Solution
Calculation:
The criterion of elimination of a variable is, if t-ratio satisfies
From the given output in step 1, the t-ratio for
Here, the t-ratio for
e.
Identify the hypothesis that can be tested to identify whether any of the peer group variables provided useful information about y.
Explain if any one of the test procedures presented in the chapter can be used.
e.
Explanation of Solution
Calculation:
Hypotheses:
Null hypothesis:
Alternative hypothesis:
There are no procedures presented in this chapter that could be used to test the above hypotheses. In this chapter, the procedures to be tested for the model utility or significance of individual predictors are presented. Moreover, the given null hypothesis is based on the testing of a subset that contains four predictors.
Want to see more full solutions like this?
Chapter 14 Solutions
Introduction To Statistics And Data Analysis


 Calculus For The Life SciencesCalculusISBN:9780321964038Author:GREENWELL, Raymond N., RITCHEY, Nathan P., Lial, Margaret L.Publisher:Pearson Addison Wesley,
 Glencoe Algebra 1, Student Edition, 9780079039897...AlgebraISBN:9780079039897Author:CarterPublisher:McGraw Hill
 Big Ideas Math A Bridge To Success Algebra 1: Stu...AlgebraISBN:9781680331141Author:HOUGHTON MIFFLIN HARCOURTPublisher:Houghton Mifflin Harcourt